

Introduction
Materials and Methods
Materials
Sprout cultivation and sample preparation
Determination of pH
Color measurement
Chlorophyll measurement
Amino acid analysis
Determination of DPPH free radical scavenging activity and polyphenol content
Statistical analysis
Results
pH
Color value
Chlorophyll content
Amino acid content
Antioxidant potential
Discussion
Introduction
Wheat (Triticum aestivum L.) is one of the major global food crops. In the human diet, wheat is mainly consumed as the products prepared from flours, the nutritional value of which gets decreased as compared to the whole grains (Yun et al., 2018). Most dietary fiber, resistant starch, vitamins, minerals, and phytochemicals, including polyphenols, which are present in the germ and bran, are normally wasted by milling (Dykes and Rooney, 2007; Liyana-Pathirana and Shahidi, 2007; Slavin, 2004; Vaher et al., 2010). For cereals like wheat, consumption of whole grain is considered better; however, since the whole grain needs heat treatment (roasting, boiling, and/or steaming) to convert it into palatable, a substantial proportion of health-related nutrients may be reduced with cooking (Rochfort and Panozzo, 2007).
Wheat sprouts may represent an appropriate alternative to supply a high amount of nutrients present in the wheat grains as possible in the human diet. Generally, sprouts are utilized as components of salads. In addition, it has been suggested that the declined nutritional value of the conventional wheat flours and derivatives could, to a great extent, be restored by blending the dried sprout powders (Świeca et al., 2017) without compromising people's feeding behaviors.
The phenolic acids and flavonoids found in wheat grains (Dinelli et al., 2011; Vaher et al., 2010; Zhang et al., 2012) and sprouts (Alvarez‐Jubete et al., 2010; Van Hung et al., 2011) are getting attentions in research works. Majority of the phenolic acids present in wheat consists of the bound phenolic compounds as the derivatives of hydroxycinnamic and hydroxybenzoic acids, which remain in the cell walls (Dinelli et al., 2011; Vaher et al., 2010). Ferulic, vanillic, caffeic, syringic, and p‐coumaric acids are the common phenolic acids present in the wheat grains (Liu, 2007). Among these, ferulic acid is the major phenolic compound (Adom and Liu, 2002) which is considered to be a vital component for antioxidant activity (Anson et al., 2008; Kim et al., 2006; Mpofu et al., 2006).
Sprouts can easily be produced without using any expensive technique. Seed sprouting, usually, increase nutritional value (Gulewicz et al., 2008) and decrease anti-nutritional factors, thus making the sprouts more beneficial for human health (Luo et al., 2013). It has been recognized as an appropriate technology for the sustainable production of nutritious vegetables year-round. It can, therefore, be applicable to help fight against malnutrition (Wei et al., 2013), especially in the poor and developing countries.
Wheat is a common cereal worldwide. In addition to its consumption as a staple food and use in different food items, wheat possesses a big potential to be used in producing nutritious sprouts. People are becoming more conscious regarding the health effects of the foods they consume. Also, the food demands of consumers have also been diversified these days. Although extensive studies have been carried out regarding the quality and nutritional value of sprouts of legumes like soybean, very limited studies have been conducted on the nutritional and functional potentials of sprouts of Korean wheat cultivar. Considering the nutritional value of wheat and people’s attraction towards new food items, this study was conducted to investigate the quality characteristics and antioxidant potential of wheat sprouts.
Materials and Methods
Materials
Wheat (Triticum aestivum L.) seeds of cultivar “Tapdong” was obtained from the Agricultural Research and Extension Services, Gyeongsangbuk-do, Korea. The mean 100-seed weight of the seed sample was 4.6 g.
The following chemicals and reagents: 1,1-diphenly-2-picrylhydrazyl (DPPH), Folin-Ciocalteau-reagent, dimethyl sulfoxide, and gallic acid were purchased from Sigma-Aldrich (Sigma-Aldrich Corporation, St. Louis, MO, USA) and amino standards were obtained from Wako (Wako Pure Chemical Industries, Ltd., Osaka, Japan). All chemicals used in this study were of analytical grade.
Sprout cultivation and sample preparation
Wheat seeds were cleaned to remove debris and external materials. Two hundred grams of intact seeds were washed with tap water for surface cleaning and then soaked in tap water for 5 h. After 5 h of soaking, water was drained out and the seeds were put into 5-L plastic buckets having a perforated base for sprout cultivation. The buckets containing the sprouting seeds were watered for 2 min every 24 h. The experiment was conducted at room temperature (23±2℃) for 30 d. Wheat sprouts were harvested at 10, 20, and 30 d and were named as WS-10, WS-20, and WS-30, respectively. The fresh sprouts after each harvest were stored at -70℃ for 24 h before freeze-drying. The freeze-dried sprouts were powdered using a grinder (HIL-G-501, Hanil Co., Seoul, Korea) and passed through a 100-mesh sieve. The powdered samples were stored at -20℃ until analyses.
Determination of pH
One gram of sprout powder was mixed with 9 mL distilled water and left for 1 h at room temperature followed by filtration through a filter paper (Whatman No. 4). The pH value of wheat sprouts was measured using a pH meter (PHS-3BW, Bante Instrument Co., Ltd., Shanghai, China).
Color measurement
The International Commission on Illumination (CIE) Lab color scale was used to determine Hunter L* (lightness), a* (redness, + or greenness, −), and b* (yellowness, + or blueness, −) values of the sprout powders. Color values were measured using a Chroma Meter (CR-300; Minolta Corporation, Osaka, Japan). A Minolta calibration plate (YCIE=94.5, XCIE=0.3160, YCIE=0.3330) and a Hunter lab standard plate (L*= 97.51, a*= −0.18, b*= +1.67) were used to standardize the instrument with D65 illuminant as described earlier (Kim et al., 2014).
Chlorophyll measurement
The total chlorophyll content of the sprout samples was calculated following the equation of (Arnon, 1949) as described by Adhikari et al. (2019). One hundred milligrams of the ground sprouts were extracted with 7 mL of dimethyl sulfoxide at room temperature for 24 h. The extraction mixture was filtered through a filter paper (Whatman No. 4) and a final volume of 10 mL of the extract was made with dimethyl sulfoxide. The absorbance of extracts was measured at 644 ㎚ and 662 ㎚ using a microplate spectrophotometer (Multiskan GO, Thermo Fischer Scientific, Vantaa, Finland).
Total chlorophyll = 20.2 ×(OD_644 ) + 8.02 ×(OD_662 ) ㎎/L
where ‘OD’ is the optical density measured at the respective wavelengths.
Amino acid analysis
Amino acid composition of the sprout powder was analyzed using an amino acid analyzer (Biochrom- 20, Pharmacia Biotech Co., Stockholm, Sweden) as described earlier (Je et al., 2005; Kim et al., 2016). One gram sample powder was hydrolyzed with 6 N hydrochloric acid (10 mL) in a sealed-vacuum ampoule at 110℃ for 24 h. The hydrochloric acid was removed using a rotary evaporator, and then the extract was mixed with 5 mL 0.2 M sodium citrate buffer (pH 2.2). The mixture was passed through a cartridge (C18 Sep-Pak, Waters Co., Milford, MA, USA) and filtered through a 0.22 ㎛ membrane filter (Millipore, Billerica, MA, USA).
For determination of free amino acids, the sample powder (1.5 g) was homogenized (12,000 rpm, 2 min) with ice-cold 6% (v/v) perchloric acid (10 mL) in an ice bath using an ACE homogenizer (Nissei AM-7, Nihonseikei Kaisha Ltd., Tokyo, Japan) and then incubated in ice for 30 min. The ice-cooled sample mixture was centrifuged at 4,600´g for 15 min and the supernatant was filtered through a filter paper (Whatman No. 41). The pH of the filtrate was adjusted to 7.0 using KOH solution (33%, w/v) before centrifuging at 4,600´g for 10 min to separate the precipitate of potassium perchlorate out of the reaction mixture. The pH of the supernatant was adjusted to 2.2 using 10 M hydrochloric acid and distilled water was added to make the final volume 50 mL. Two milliliters of the reaction mixture were mixed with 1 mL lithium citrate buffer (pH 2.2) and the mixture was used to determine the free amino acids using the amino acid analyzer.
Determination of DPPH free radical scavenging activity and polyphenol content
The DPPH free radical scavenging potential was determined through the DPPH free radical scavenging activity (Blois, 1958; Dhungana et al., 2016). Sprout powder (1 g) was extracted with absolute methanol (10 mL) at room temperature for 6 h. The concentration of sample extract was 10% (w/v). The extract mixture was centrifuged at 1,660´g for 10 min and then the supernatant was filtered through a syringe filter (0.22 ㎛). Fresh DPPH solution (0.1%, w/v) was prepared in absolute methanol. An equal volume (100 µL) of sample extract and freshly prepared DPPH solution was mixed in microplate wells and left in dark for 30 min. The absorbance of reaction mixtures was measured at 517 ㎚ using a microplate spectrophotometer (Multiskan GO, Thermo Fischer Scientific, Vantaa, Finland). The DPPH radical scavenging activity was calculated based on the absorbance (A) values of reaction mixtures using the following equation:
DPPH radical scavenging potential (%) = 1-(A-Ab)/Ao × 100
where A is the absorbance of sample and DPPH mixture, and Ab is the absorbance of sample and methanol mixture, and Ao is the absorbance of DPPH and methanol mixture.
The total polyphenol content in sprout powders was measured following the Folin-Ciocalteau method (Singleton et al., 1999) as described earlier (Dhungana et al., 2015). Sample extracts were prepared as in the DPPH assay. Fifty microliters of sample extracts were mixed with 1000 μL of 2% (w/v) aqueous Na2CO3 and kept for 3 min. After 3 min of incubation, 50 μL of freshly diluted 1 N Folin-Ciocalteau reagent in distilled water was added to the mixture and incubated in dark at room temperature for 30 min. The absorbance value of reaction mixtures was measured at 750 ㎚ using a microplate spectrophotometer (Multiskan GO). Gallic acid was used as a standard to make a calibration curve. Polyphenol was determined as gallic acid equivalents (㎍ GAE/g dry weight).
Statistical analysis
Data were subjected to analysis of variance using SAS 9.4 (SAS Institute, Cary, NC, USA). The significant differences between sample means were identified using Tukey test at p < 0.05. Average values of three replications are reported.
Results
pH
The pH value of wheat sprouts significantly varied with harvest time (Fig. 1). The sprouts harvested at 10 d after cultivation was slightly acidic than those harvested 20 and 30 d after cultivation. The highest pH value was found in WS-30 (5.95) and the lowest in WS-10 (5.67).

Fig. 1.
Change in pH of wheat sprouts by harvested at different times after cultivation. WS-10, WS-20, and WS-30, wheat sprouts harvested at 10, 20, and 30 d, respectively. Different letters above the bar diagrams of the types of wheat sprout are significantly different (p < 0.05). The vertical line in the bars show standard deviation (n = 3).
Color value
The color of wheat sprouts was significantly different from the cultivation duration (Table 1). The lightness and yellowness values (36.52 and 7.41) of WS-20 were significantly lower but the redness value (-5.23) was higher than those of the other two samples. The color values of WS-10 and WS-30 were not significantly different.
Table 1. Hunter’s color value of wheat sprouts harvested at different times after cultivation
zSamples are defined in Fig. 1.
yL; lightness (100, white; 0, black), a: redness (-, green; +, red), b: yellowness (-, blue; +, yellow).
xValues are means ±SD of triplicate measurements. The values followed by different superscripts in the same column are significantly different (p < 0.05).
Chlorophyll content
The chlorophyll content of wheat sprouts was decreased with cultivation time (Fig. 2). Two sprout samples WS-10 (34.91) and WS-20 (33.70) did not show a significant difference in their chlorophyll content, which was higher than that of WS-30 (28.42).
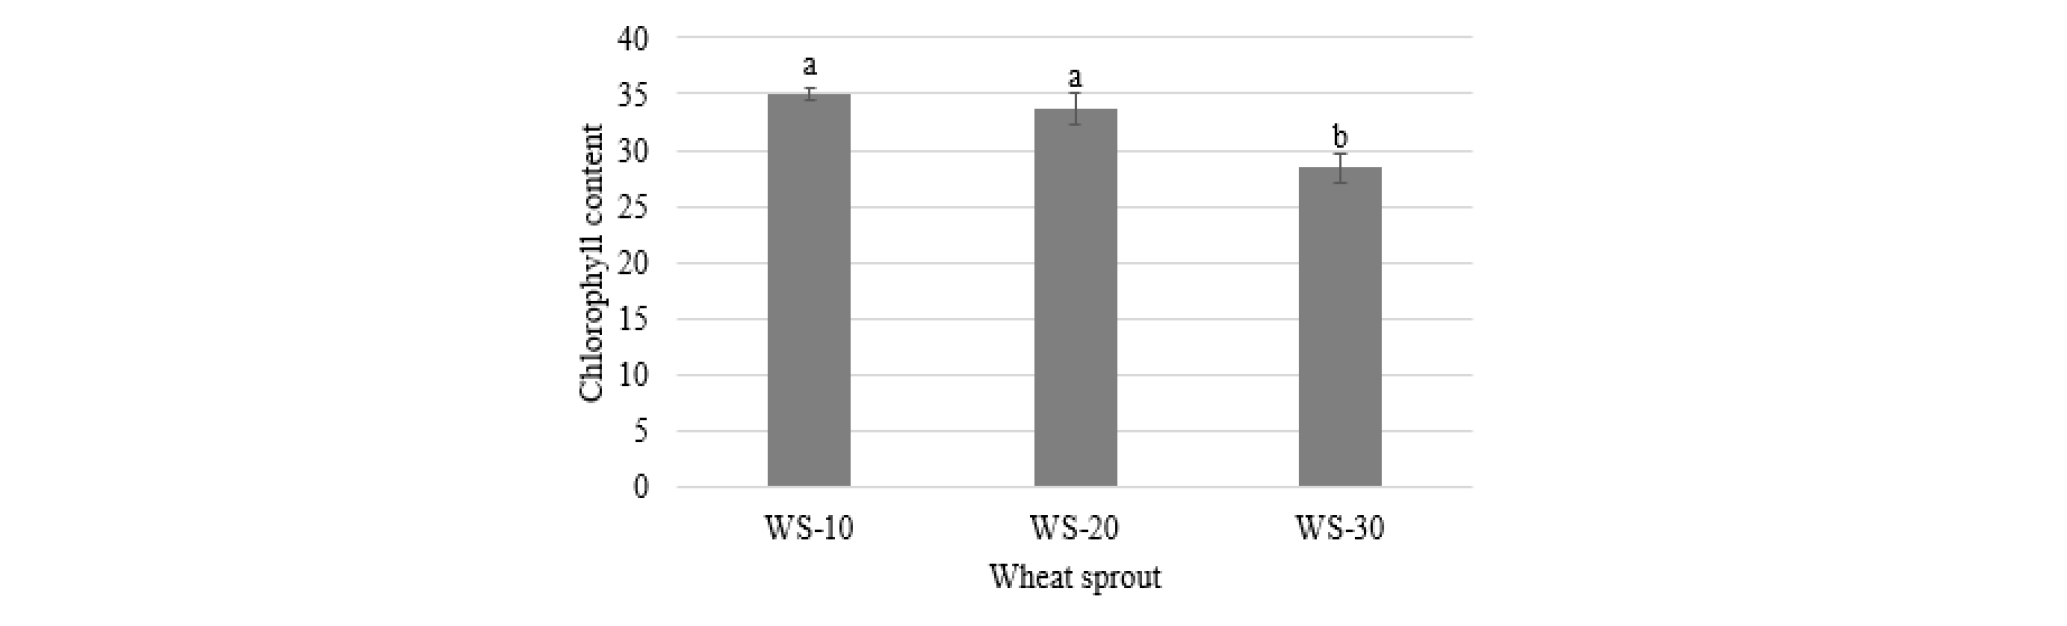
Fig. 2.
Chlorophyll content of wheat sprouts harvested at different times after cultivation. Names of wheat sprout are defined in Fig. 1. Different letters above the bar diagrams of the types of wheat sprout are significantly different (p < 0.05). The vertical line in the bars show standard deviation (n = 3).
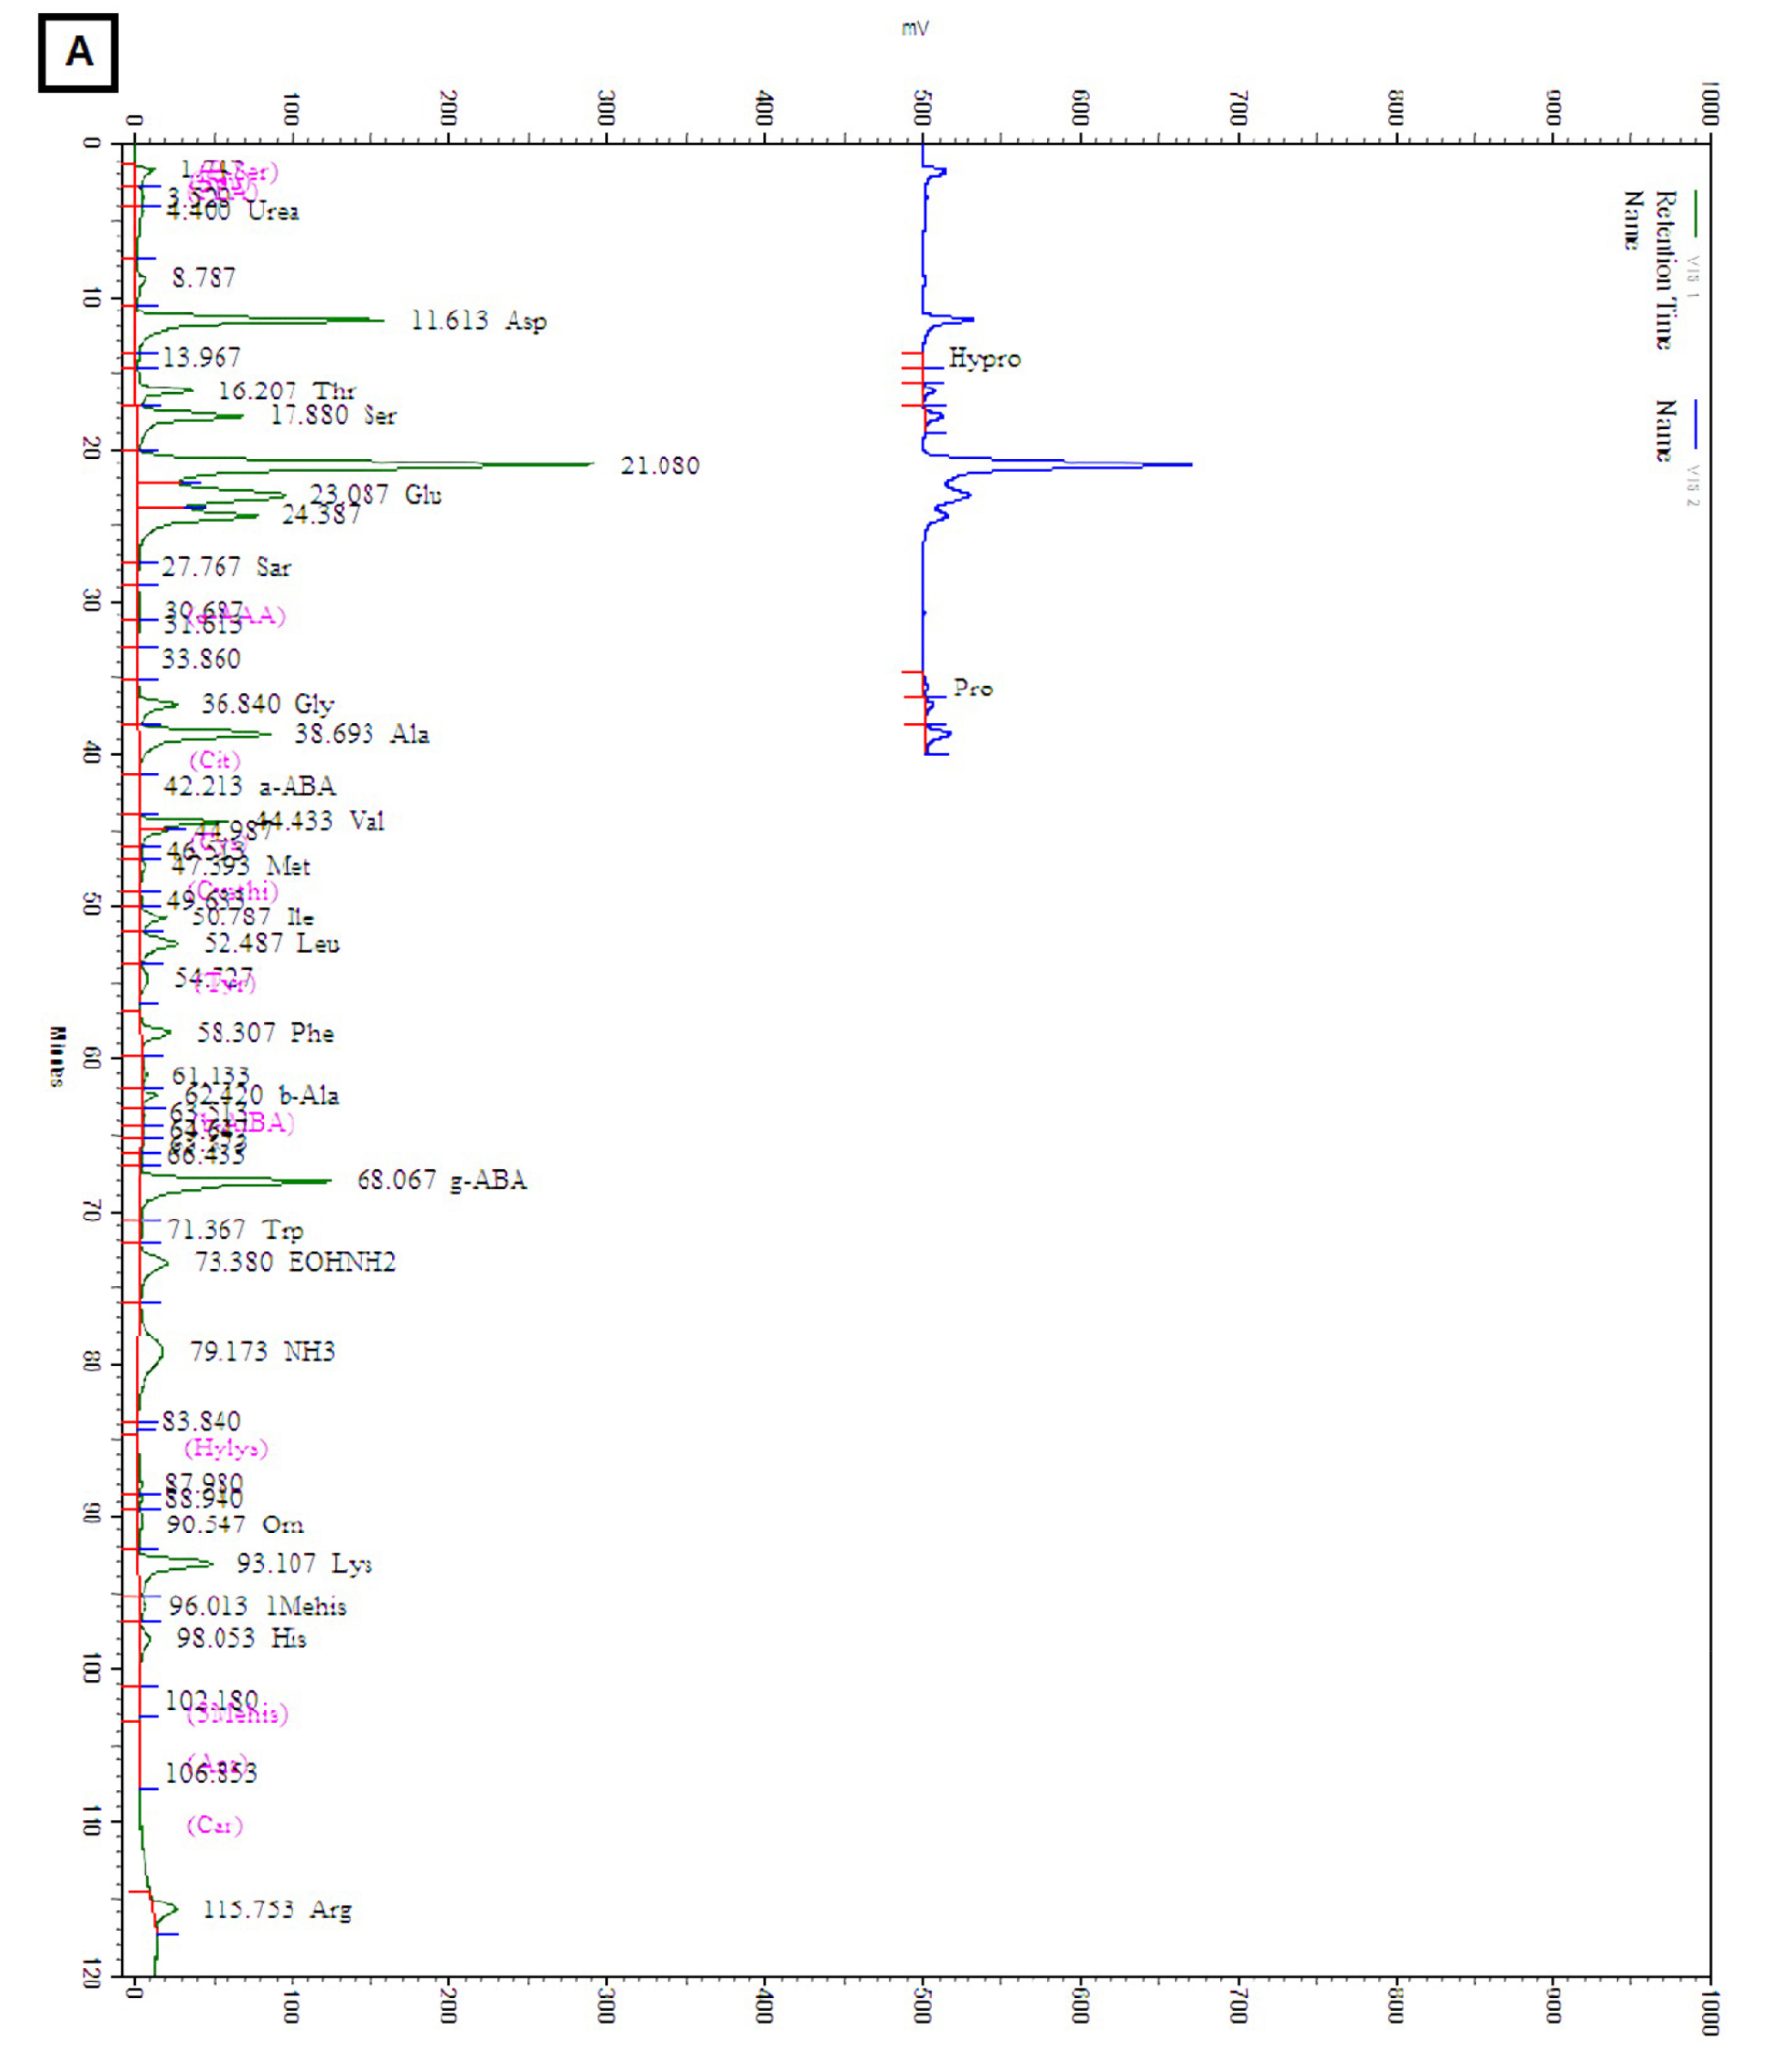
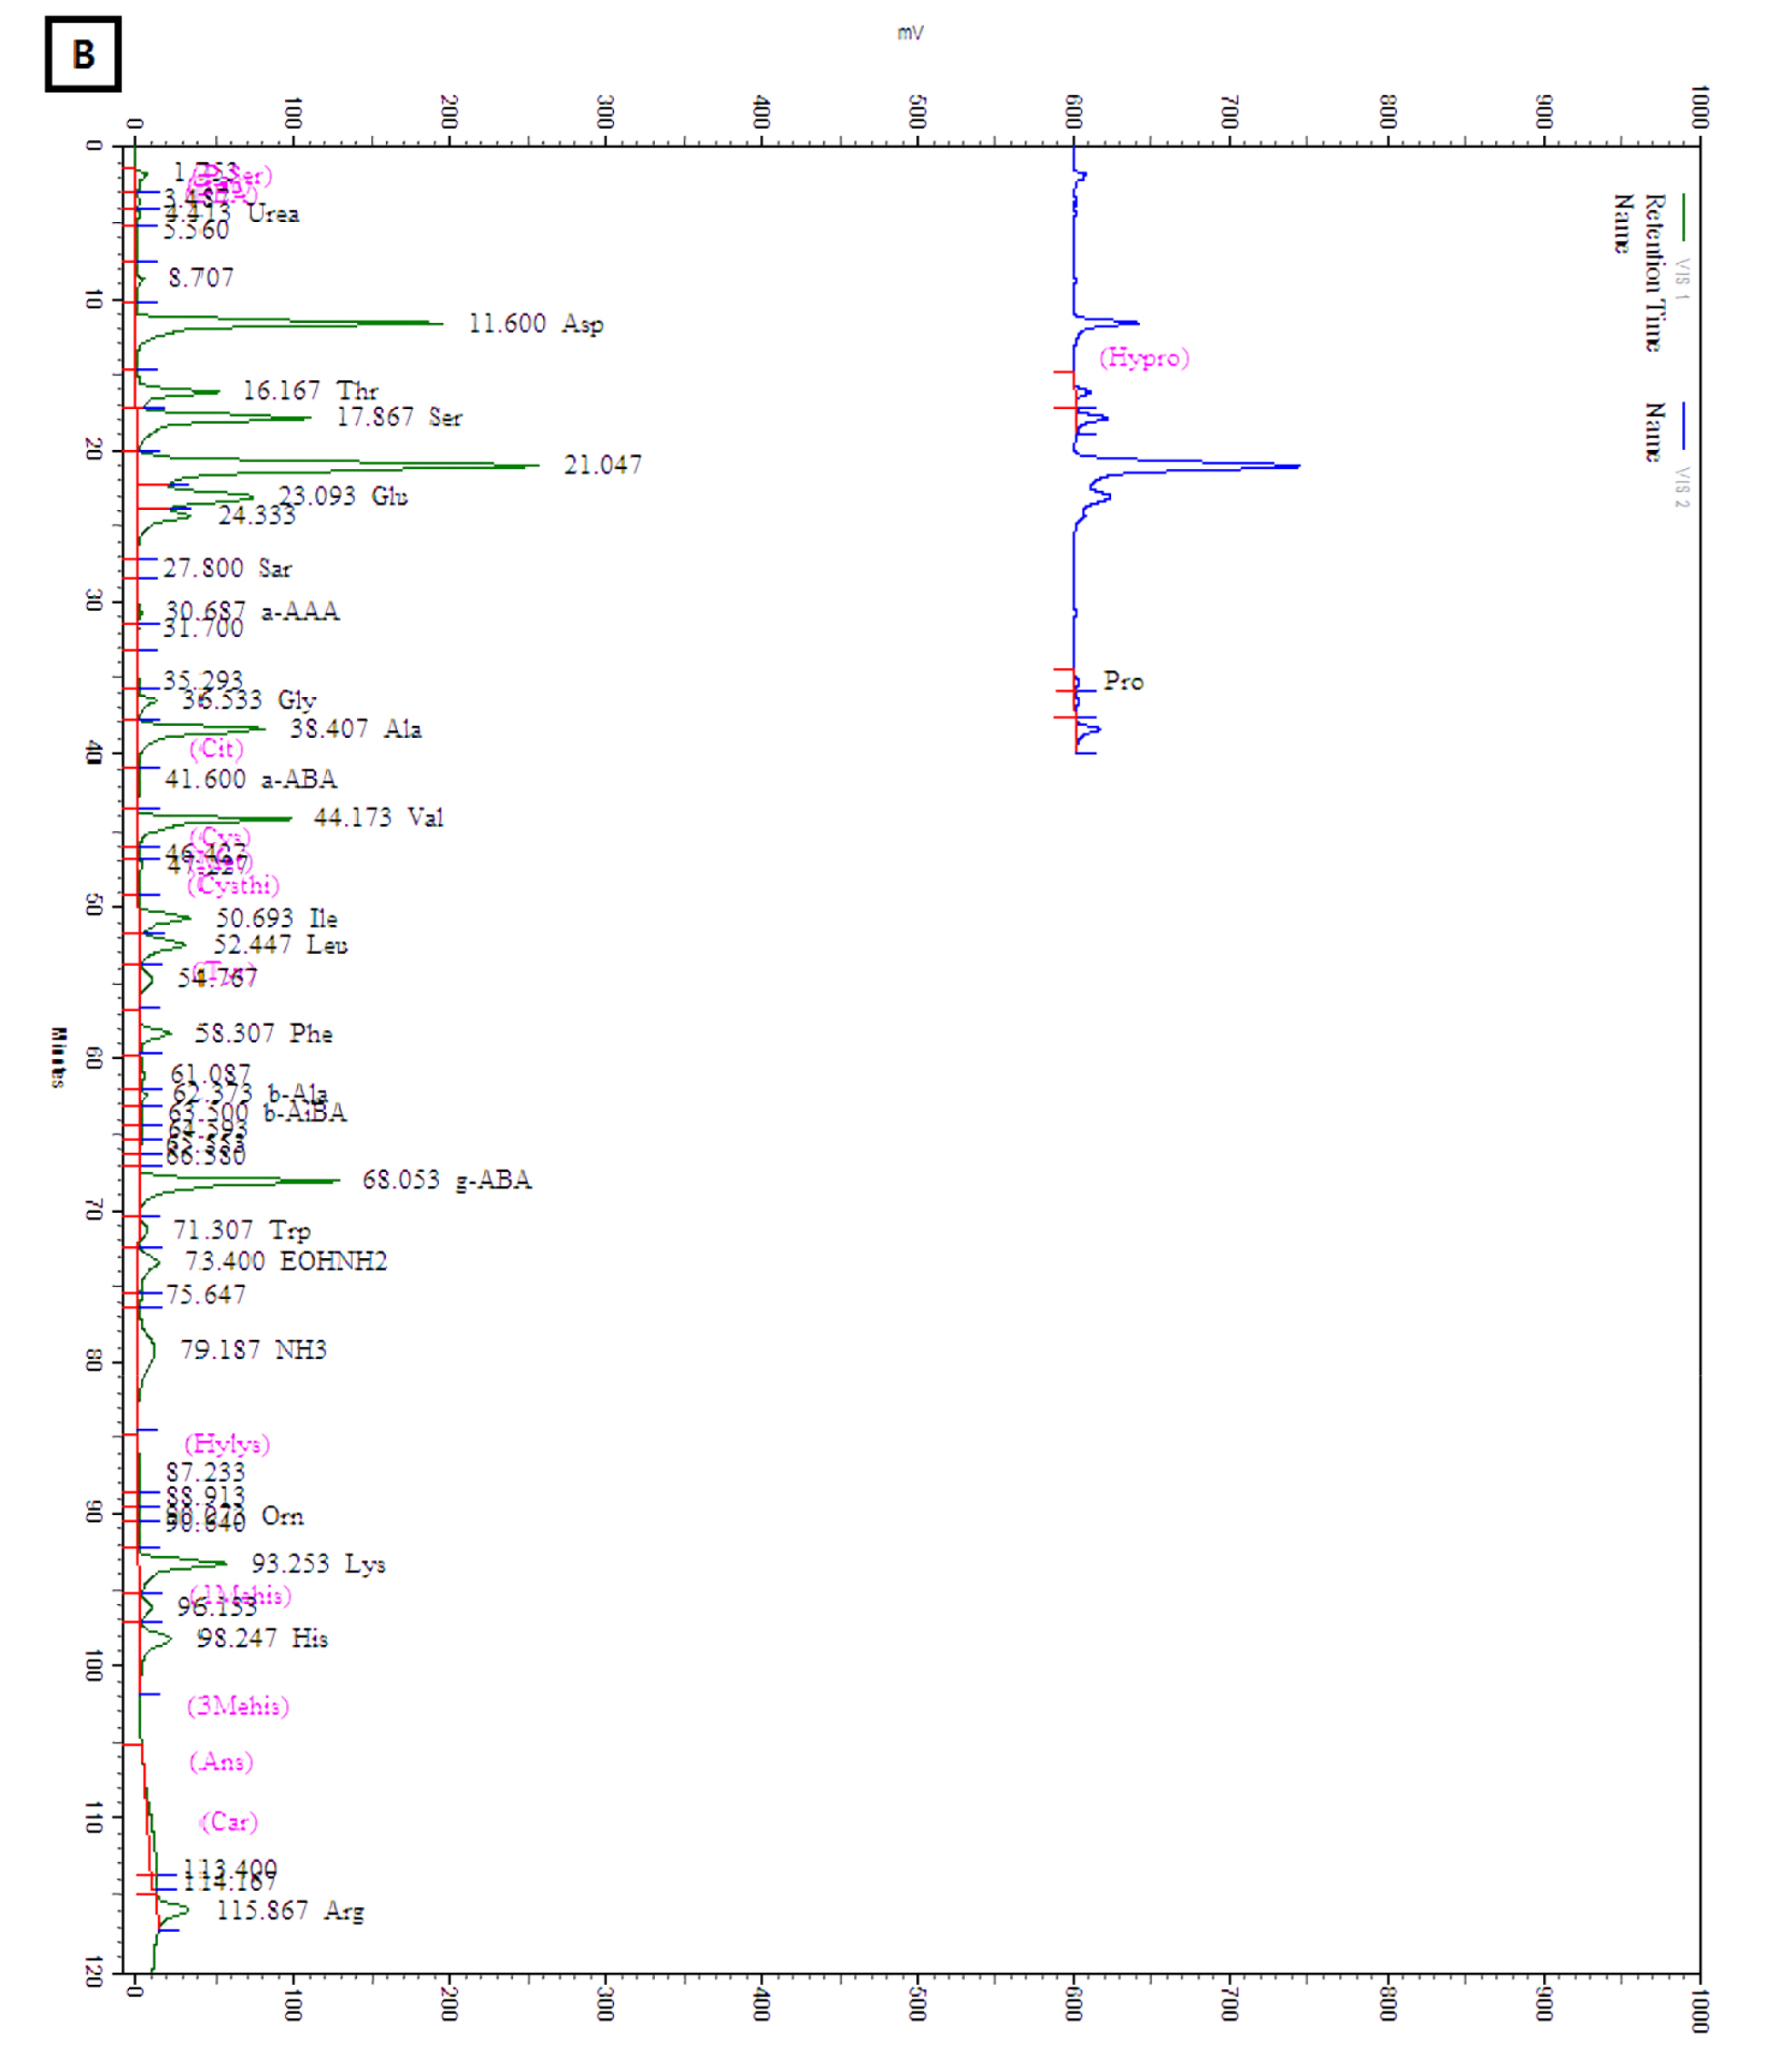
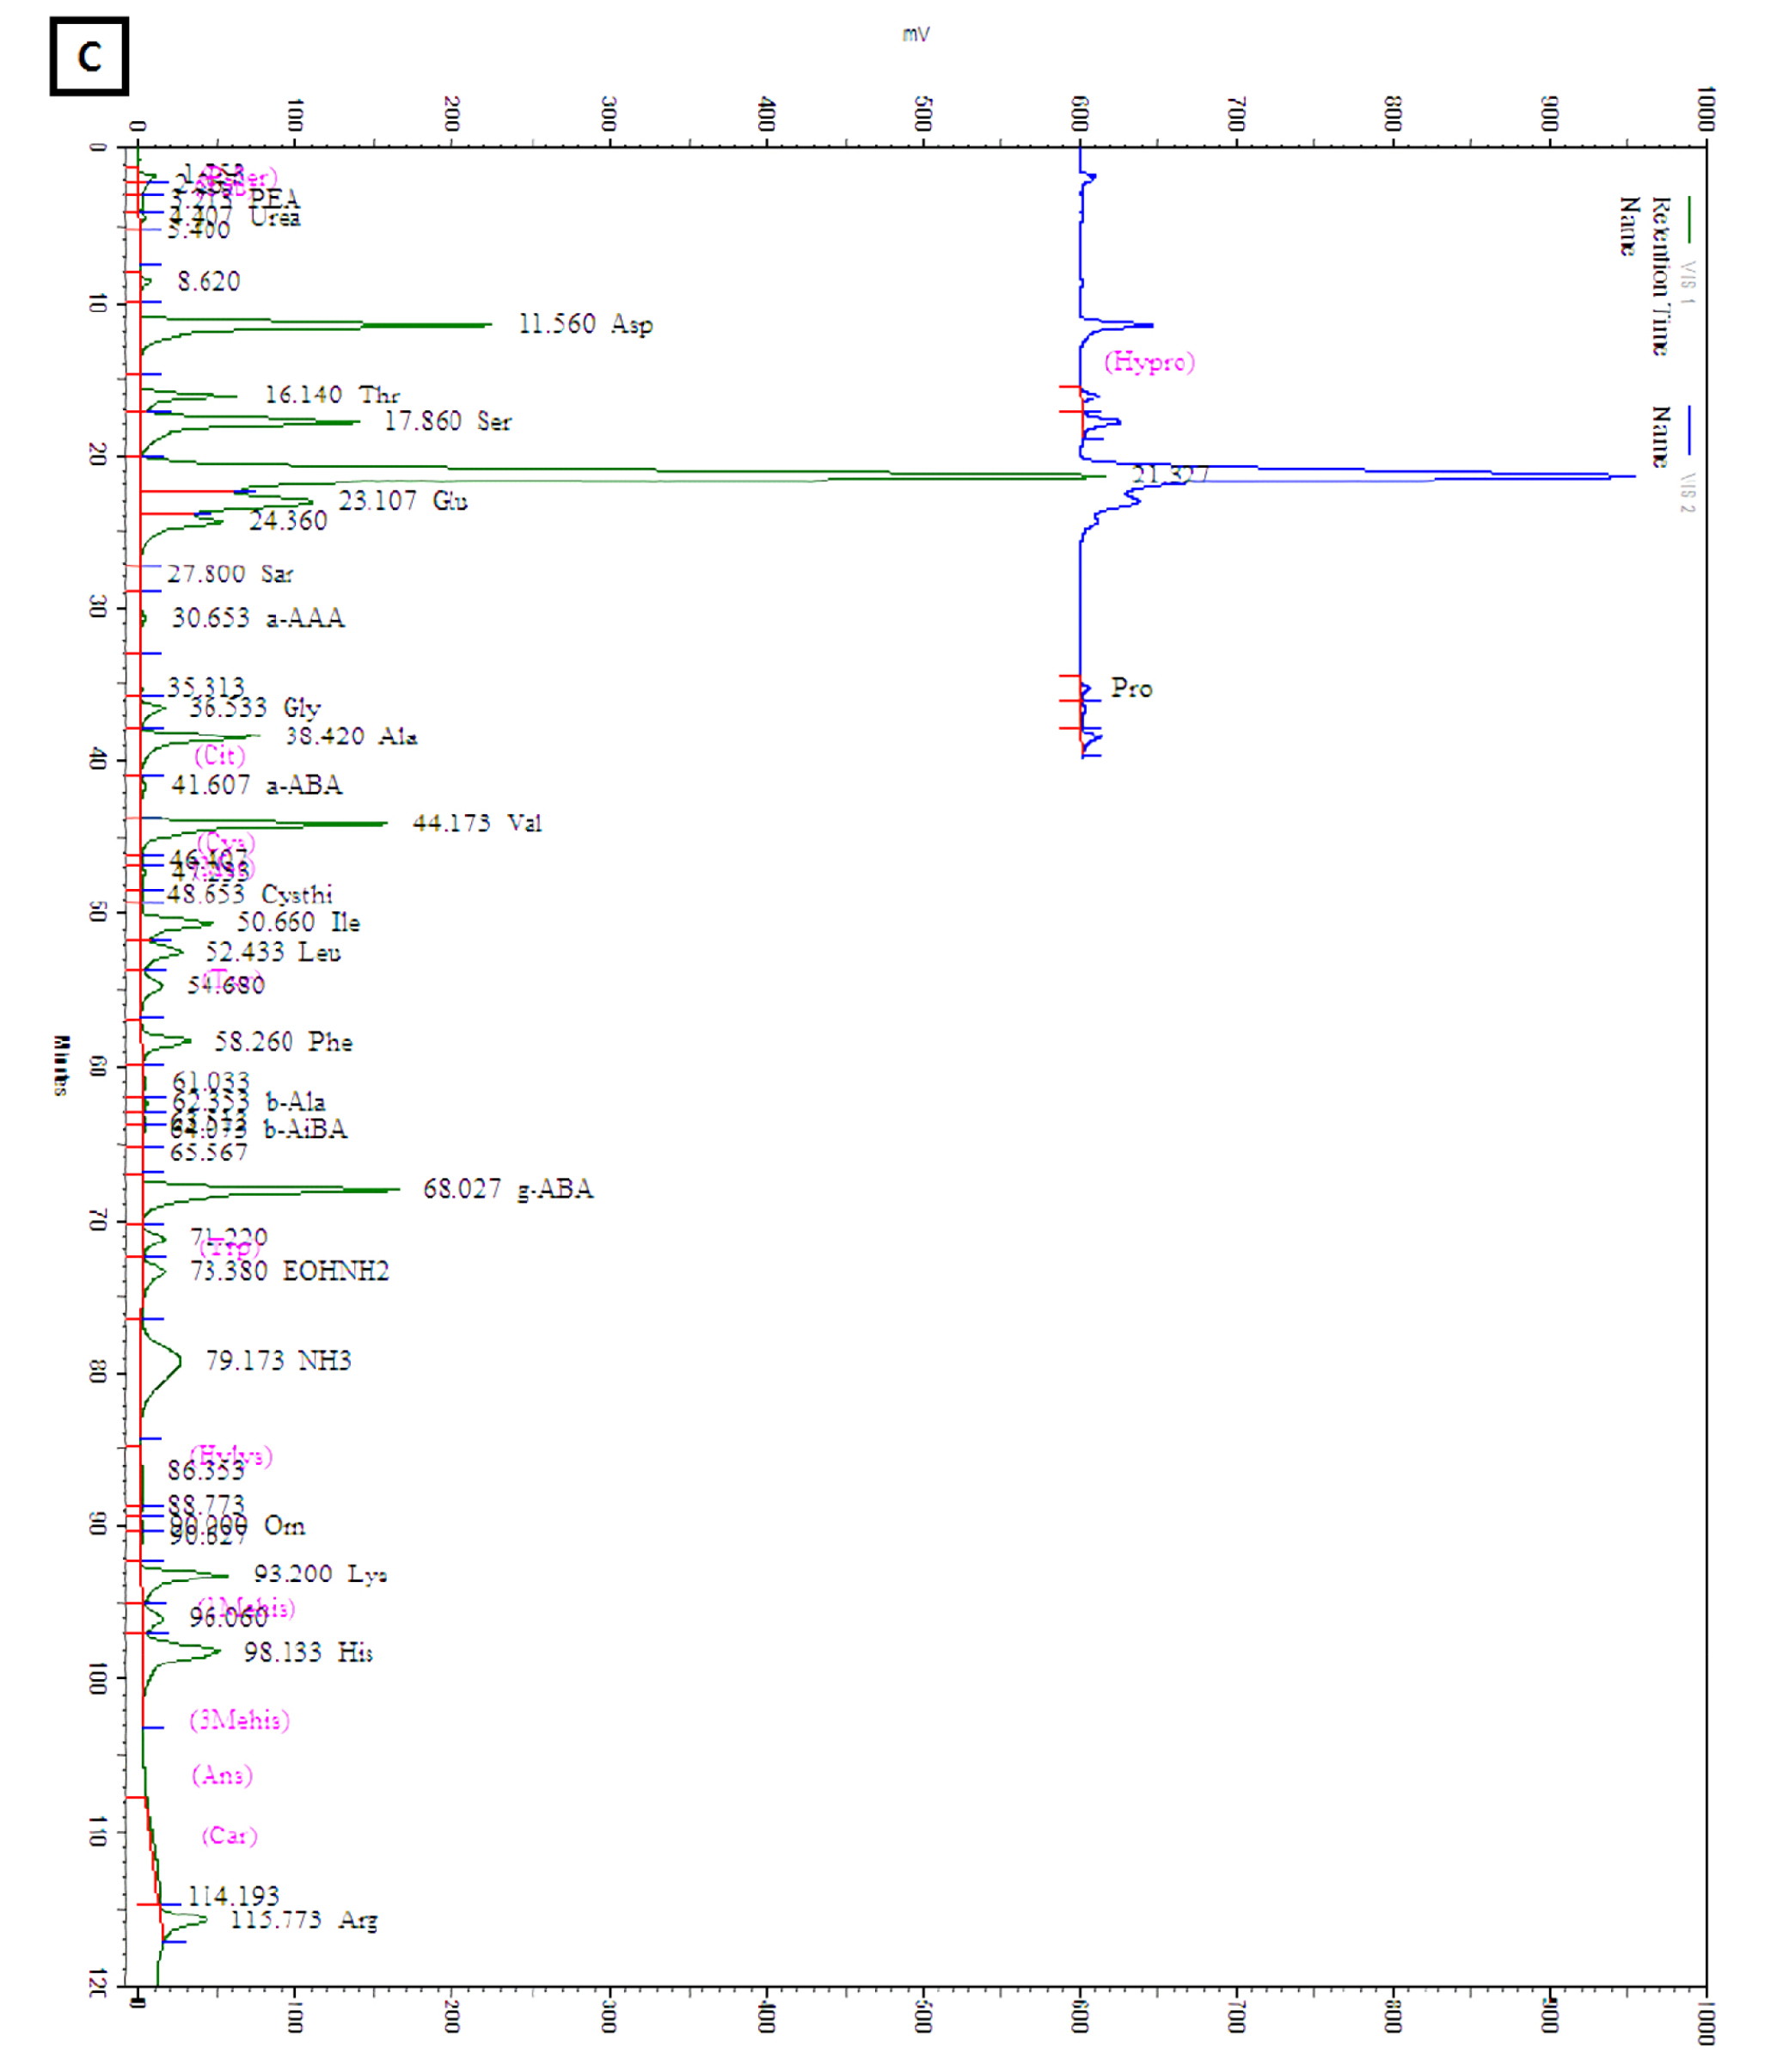
Amino acid content
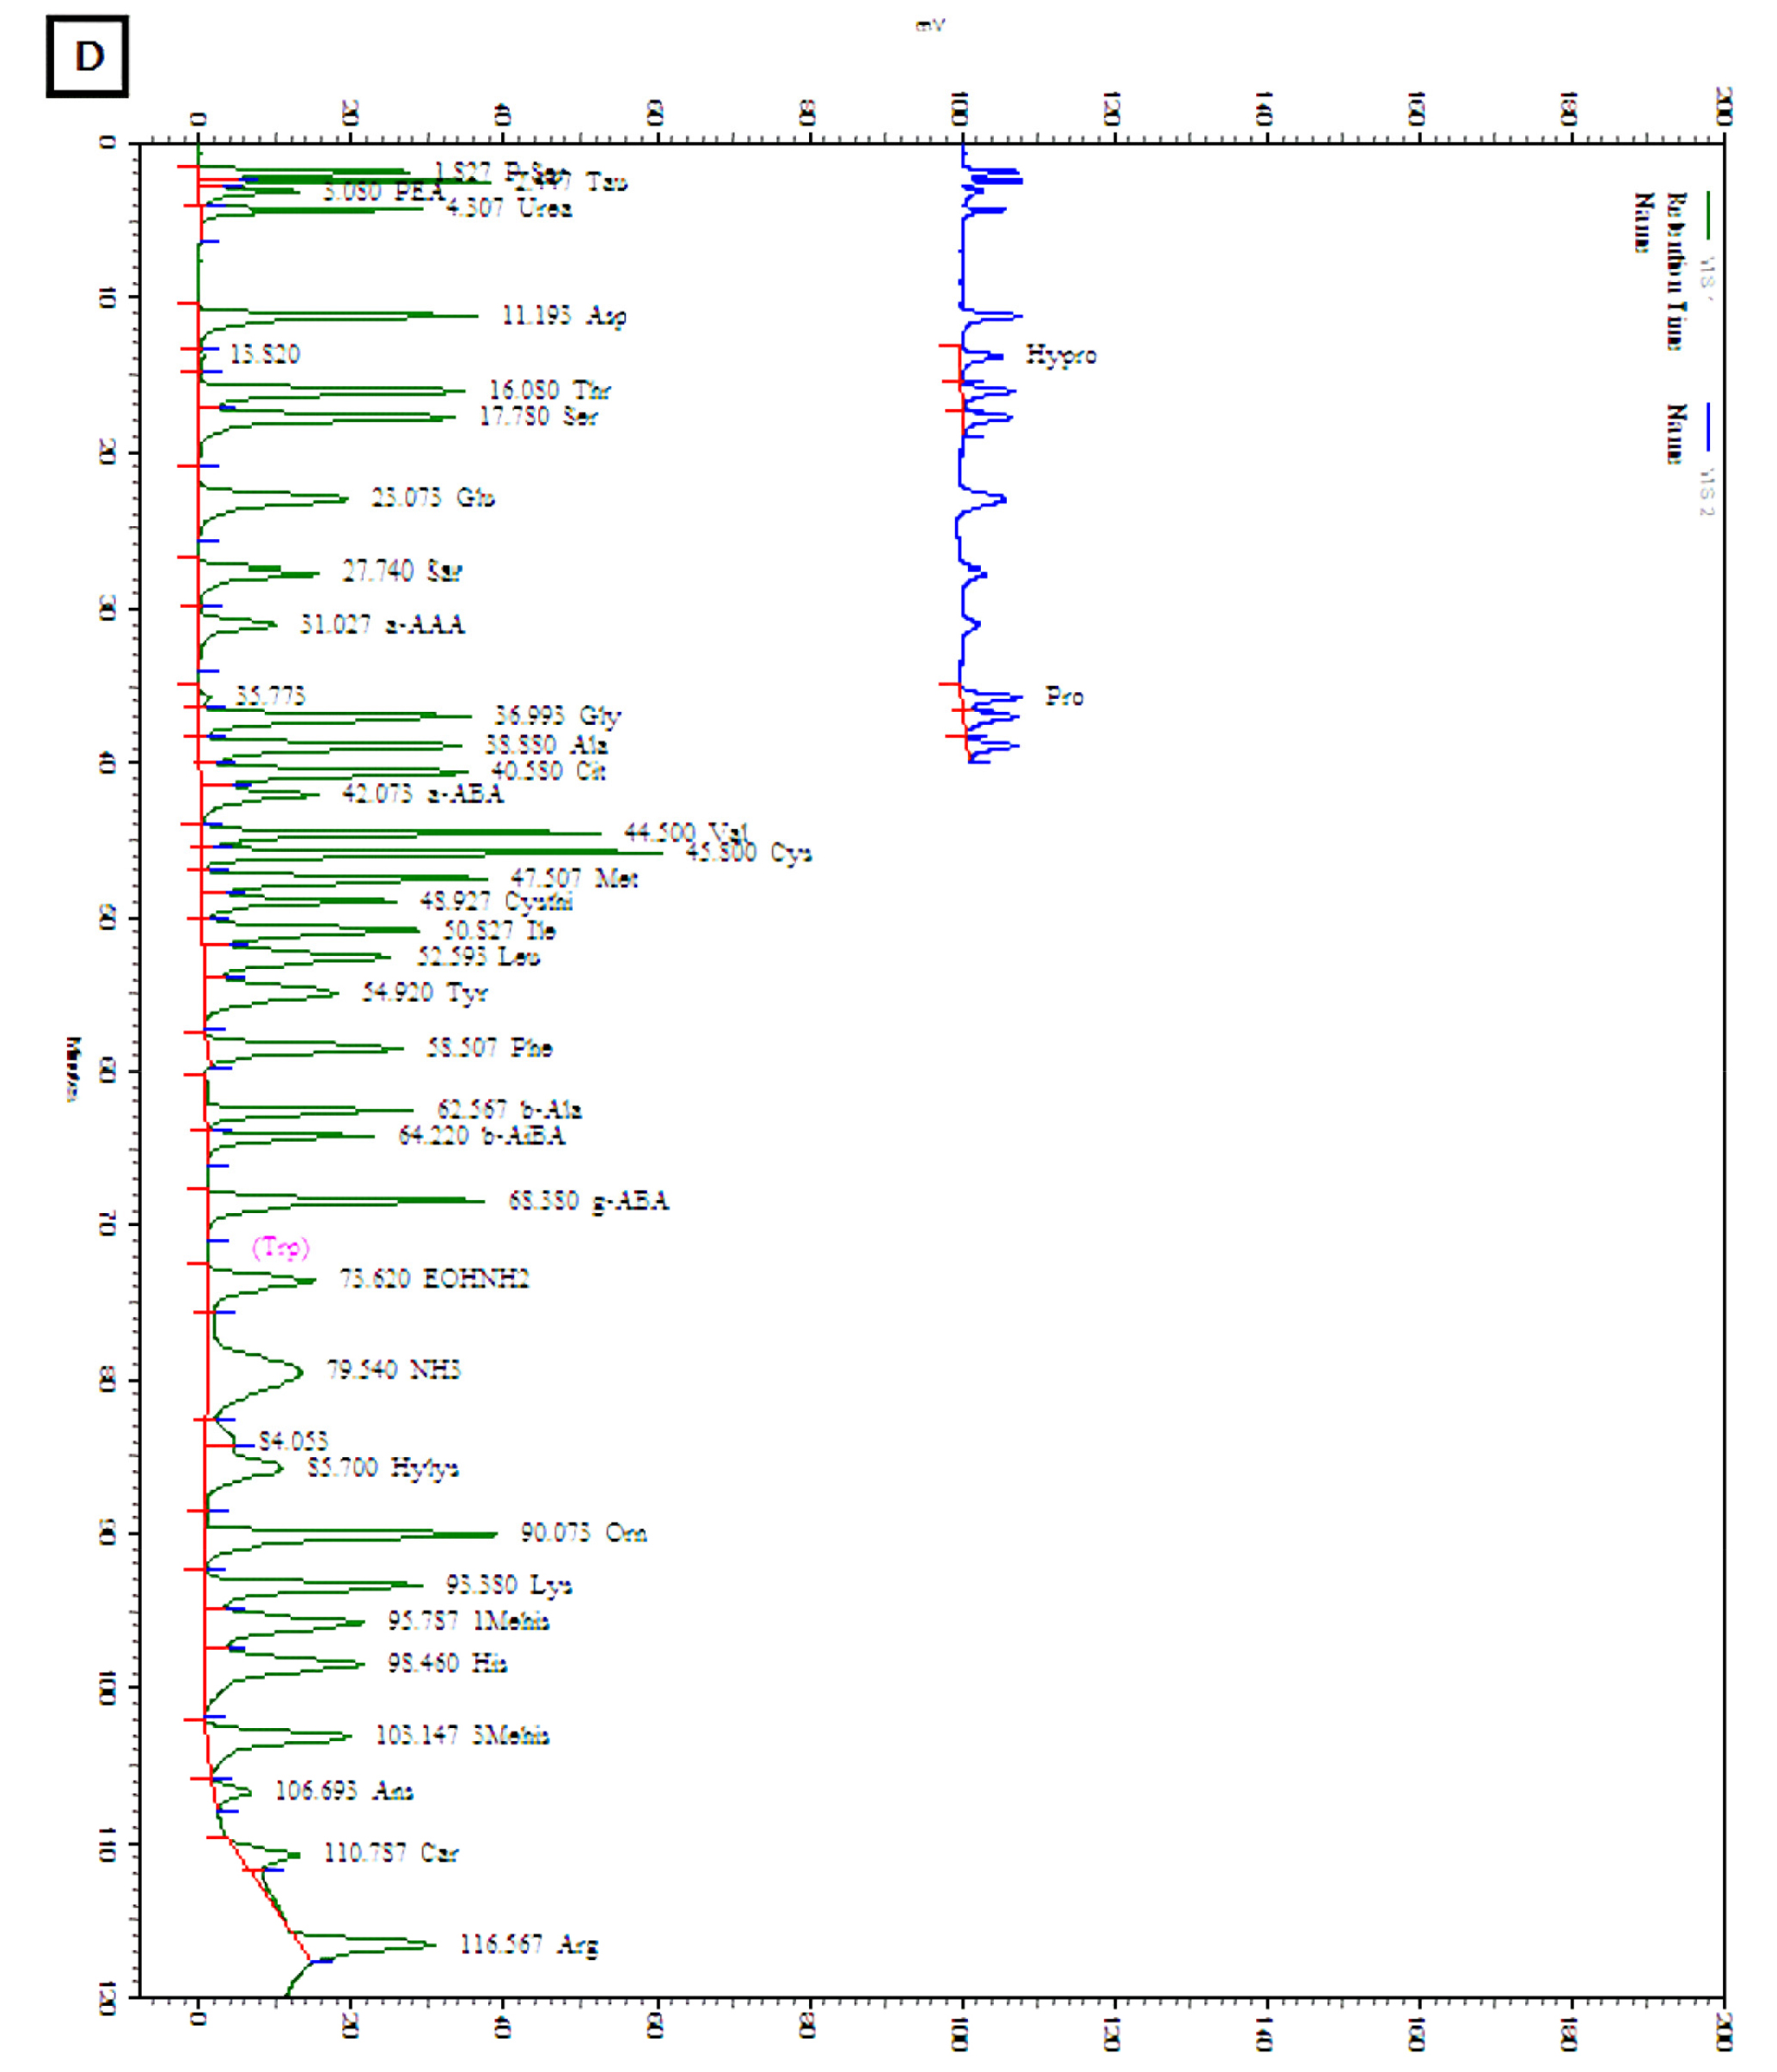
The amounts of total and individual free amino acids found in the three wheat sprout samples are shown in Table 2. The chromatograms of the free amino acids identified in the wheat sprouts are shown in Fig. 3. A total of 28 free amino acids were detected at least in one sample, out of which 8 essential and 20 non-essential amino acids were found at least in one sprout sample. Nine non-essential amino acids, taurine, O-phospho ethanol amine, L-citrulline, L-cystine, cystathionine, hydroxylysine, 3-methly-L-histidine, L-anserine, and L-carnosine were not detected in any sample. The highest amount of total free amino acid was detected in WS-30 (22.71 ㎎/g) followed by WS-10 (18.49 ㎎/g).
Table 2. Amino acid content of wheat sprouts harvested at different times after cultivation
zSamples are defined in Fig. 1.
yValues are means ± SD of triplicate measurements, the values followed by different letters in the same column are significantly different (p < 0.05).
xNon-detectable.
Antioxidant potential
The antioxidant potential of sprout samples measured through DPPH and total polyphenol content of wheat sprouts significantly varied with cultivation time (Table 3). The DPPH scavenging potential of WS-10 (41.66%) was significantly higher than the other samples. The total polyphenol content of WS-10 (230.48 ㎍ GAE/g) and WS-20 (233.25 ㎍ GAE/g) was significantly higher than that of WS-30 (223.26 ㎍ GAE/g).
Discussion
The pH suggests the capability of any microorganism to inoculate and multiply in a food (Tyl and Sadler, 2017). The difference in pH may affect the flavor and shelf-life of food (Aysegul et al., 2007).
The color of a food product is one of the major factors with regard to consumers’ preference. It may influence the consumers in purchasing a product. The variation in color value might be due to the difference in biochemical accumulation at a different time of sprout growing.
The reduction in leaf chlorophyll content in wheat sprouts is associated with leaf age. The higher chlorophyll content in young leaves of WS-10 and WS-20 might be because of the activation of enzymes of chlorophyll synthesis and lower value in older leaves of WS-30 might be due to activation of chlorophyllase (Nikolaeva et al., 2010). Chlorophyll is reported to have health benefits because of its possible vital role in chemoprotection and anti-carcinogenesis (Chernomorsky et al., 1999; Sarkar et al., 1994).
L-glutamic acid was one of the most abundant non-essential amino acids detected in the sprout samples, and is one of the precursors of γ-amino-n-butyric acid (GABA), which is primarily synthesized in plant tissues (Nikmaram et al., 2017). Glycine and GABA, which were some of the major non-essential found in the sprout samples, are associated with brain and memory enhancement, neurological diseases; anxiety relieve, sedation, anticonvulsant, and muscle relaxation functions (Krogsgaard-Larsen, 1989; Mody et al., 1994; Oh and Oh, 2004). Another abundantly found amino acid in the sprout sample was L-aspartic acid has enhanced fish survival against a bacteria Vibrio alginolyticus infection (Gong et al., 2020).
The reduced DPPH and total polyphenol content in the WS-30 might be due to the age of sprouts (Neill et al., 2002; Su, 2013). The ability of plant tissues to accumulate polyphenols may sometimes be determined by the age of the tissue and increased in young leaves (Murray et al., 1994) and reduced with leaf age possibly due to decreased response to environmental stresses (Nozzolillo et al., 1990). Younger sprouts of wheat could be a good option to consume because antioxidant-rich foods are considered beneficial for the prevention and control of various diseases. Several enzymatic and non-enzymatic antioxidants, such as glutathione peroxidase, superoxide dismutase, glutathione peroxidase, catalase, glutathione transferase, carotenoids, vitamin C, vitamin E, and polyphenols contribute for antioxidant activities (Kurutas, 2015). Different factors including the oxidation conditions, partitioning characteristics of particular antioxidants, and the condition of oxidizable substrate together determine the antioxidant potential of foods (Frankle and Meyer, 2000). Therefore, a noticeable change in the amount of a particular antioxidant such as total polyphenol might not always account for higher antioxidant activity, for instance, the DPPH radical scavenging potential measured in the present study. The total polyphenol content of WS-20 was higher than that of WS-10 but its DPPH free radical scavenging potentials was lower than that of WS-10. The discrepancies in the antioxidant potentials of different sprouts might be due to the influences of various phytochemicals.
In conclusion, the phytochemical and antioxidant potential of Korean wheat sprout grown for 10, 20, and 30 days were investigated. The pH of WS-10 was significantly lower than the other samples. Hunter color values were significantly affected by the age of sprouts. Chlorophyll content was lowest, however, the total free amino acid content was highest in WS-30. On the other hand, the antioxidant potentials measured through DPPH and total polyphenol content were lowest in WS-30. The results indicated that Korean wheat sprouts could be used as a source of nutrients and natural antioxidants.
