

Introduction
Materials and Methods
Plant material
Morphological characteristics
E-nose analysis
FT-IR spectroscopic analysis
Results and Discussion
Morphological characteristics
Discrimination of floral scents among peony cultivars using E-nose
Discrimination of metabolites among peony cultivars using FT-IR spectroscopy
Introduction
Herbaceous peony (Paeonia lactiflora Pall.), belonging to the Paeoniaceae family, is native to Central and Eastern Asia and China and is being used since ancient times for its appealing fragrant scent, beautiful huge blooms, and medicinal advantages. Today, peony is widely cultivated throughout Europe, New Zealand, Asia and North America either as ornamental or traditional medicinal plant. In Korea, cultivation area and total yield of herbaceous peony was 123 hectares (㏊) and 642 M/T, majorly used only for the production of medicinal material, which increased by 2.5% and 7% respectively in 2016 compared to its previous year (MAFRA, 2016). Roots of herbaceous peony have been traditionally regarded as a medicinal herb in Korea, China and Japan for more than 1200 years. In the traditional herbal medicine, peony roots are being used in the treatment of rheumatoid arthritis, fever, hepatitis, systemic lupus erythematosus, inflammation and gynecological disorders such as amenorrhea and dysmenorrhea in these countries (He and Dai, 2011). Studies on root extracts of herbaceous peony are reported to be effective in anti-inflammatory, immunodulatory, anti-allergic, anti-arthritic, anti-ulcerative colitis and hepatoprotective activities (He and Dai, 2011; Lee et al., 2008; Zheng et al., 2007; Myung, 2018; Xia et al., 2017).
In recent days, peony cut flowers are popular throughout Europe, Asia and North America and hence gardeners consider peony as one of most rewarding flowers (Kamenetsky and Dole, 2012). In USA market, one of the major suppliers all over the world, the price (adjusted for inflation) of peony stem has risen with increased popularity in spite of floral market instability (Abbey, 2015). Peony is also widely used in wedding bouquets and large floral arrangements for big events in Korea. The cultivation area of peony is increased in recent years with the increased planting of cut peony cultivars imported from abroad. Flower is recently being used not only as ornamental but also as industrial raw material due to increased demand for natural ingredients in the fragrance and cosmetics industry. However, herbaceous peony grown for the traditional herbal medicinal use is usually utilized only for root production, although as a deciduous perennial herb, it can produce flowers each year. Until now, the studies of herbaceous peony have been majorly focused on functional effect of root, relatively little research has been carried out to differentiate the profiles of fragrance and metabolic compounds from peony flowers. To improve industrial availability, comprehensive studies are necessary to characterize and discriminate different cultivars based on metabolic profiles.
The major objectives of this study are to provide the basic analysis of floral scent and metabolic profiles of herbaceous peony cut flowers for cosmetics material industry and to analyze the relationship between Korean cultivar ‘Taebaek’ and imported commercial cut peony to provide preliminary data for peony breeding.
Materials and Methods
Plant material
A total of 14 cut herbaceous peony (Paeonia lactiflora Pall.) cultivars viz., ‘Blush queen’, ‘Bowl of cream’, ‘Jubilee’, ‘Peter brand’, ‘Honey gold’, ‘Snow mountain’, ‘Old faithful’, ‘Florence nicholls’, ‘Nick shaylor’, ‘Paul M. wild’, ‘Allan rogers’, ‘Elsa sass’, ‘Sarah bernhardt’ and ‘Taebaek’ were used in this study. Among these, ‘Old faithful’ is known as a fourth generation hybrid. Cut flowers of different peony cultivars used in this study were collected from the open field of World Flower Company farm, Jincheon, Korea (36°54'23.7"N 127°28'23.4"E) in May 2018. The biological identification of these cultivars was confirmed by the same company. These germplasms are maintained at the experimental field of World Flower Company farm. Voucher specimens are stored in our laboratory of floriculture research division, NIHHS.
Morphological characteristics
Various flower and leaf characteristics of 14 cut peony cultivars were evaluated. Ten different cut flowers per cultivar were used for the morphological evaluation. For flower characteristics, the flowering time, flower diameter, flower height, flower stem diameter, flower type, and flower color (outer petals/inner petals) were examined. Similarly, leaf length and leaf width were examined for leaf characteristics. All characteristics based on the measurements are given in Table 1 and Fig. 1.
Table 1. Morphological characteristics of P. lactiflora cultivars
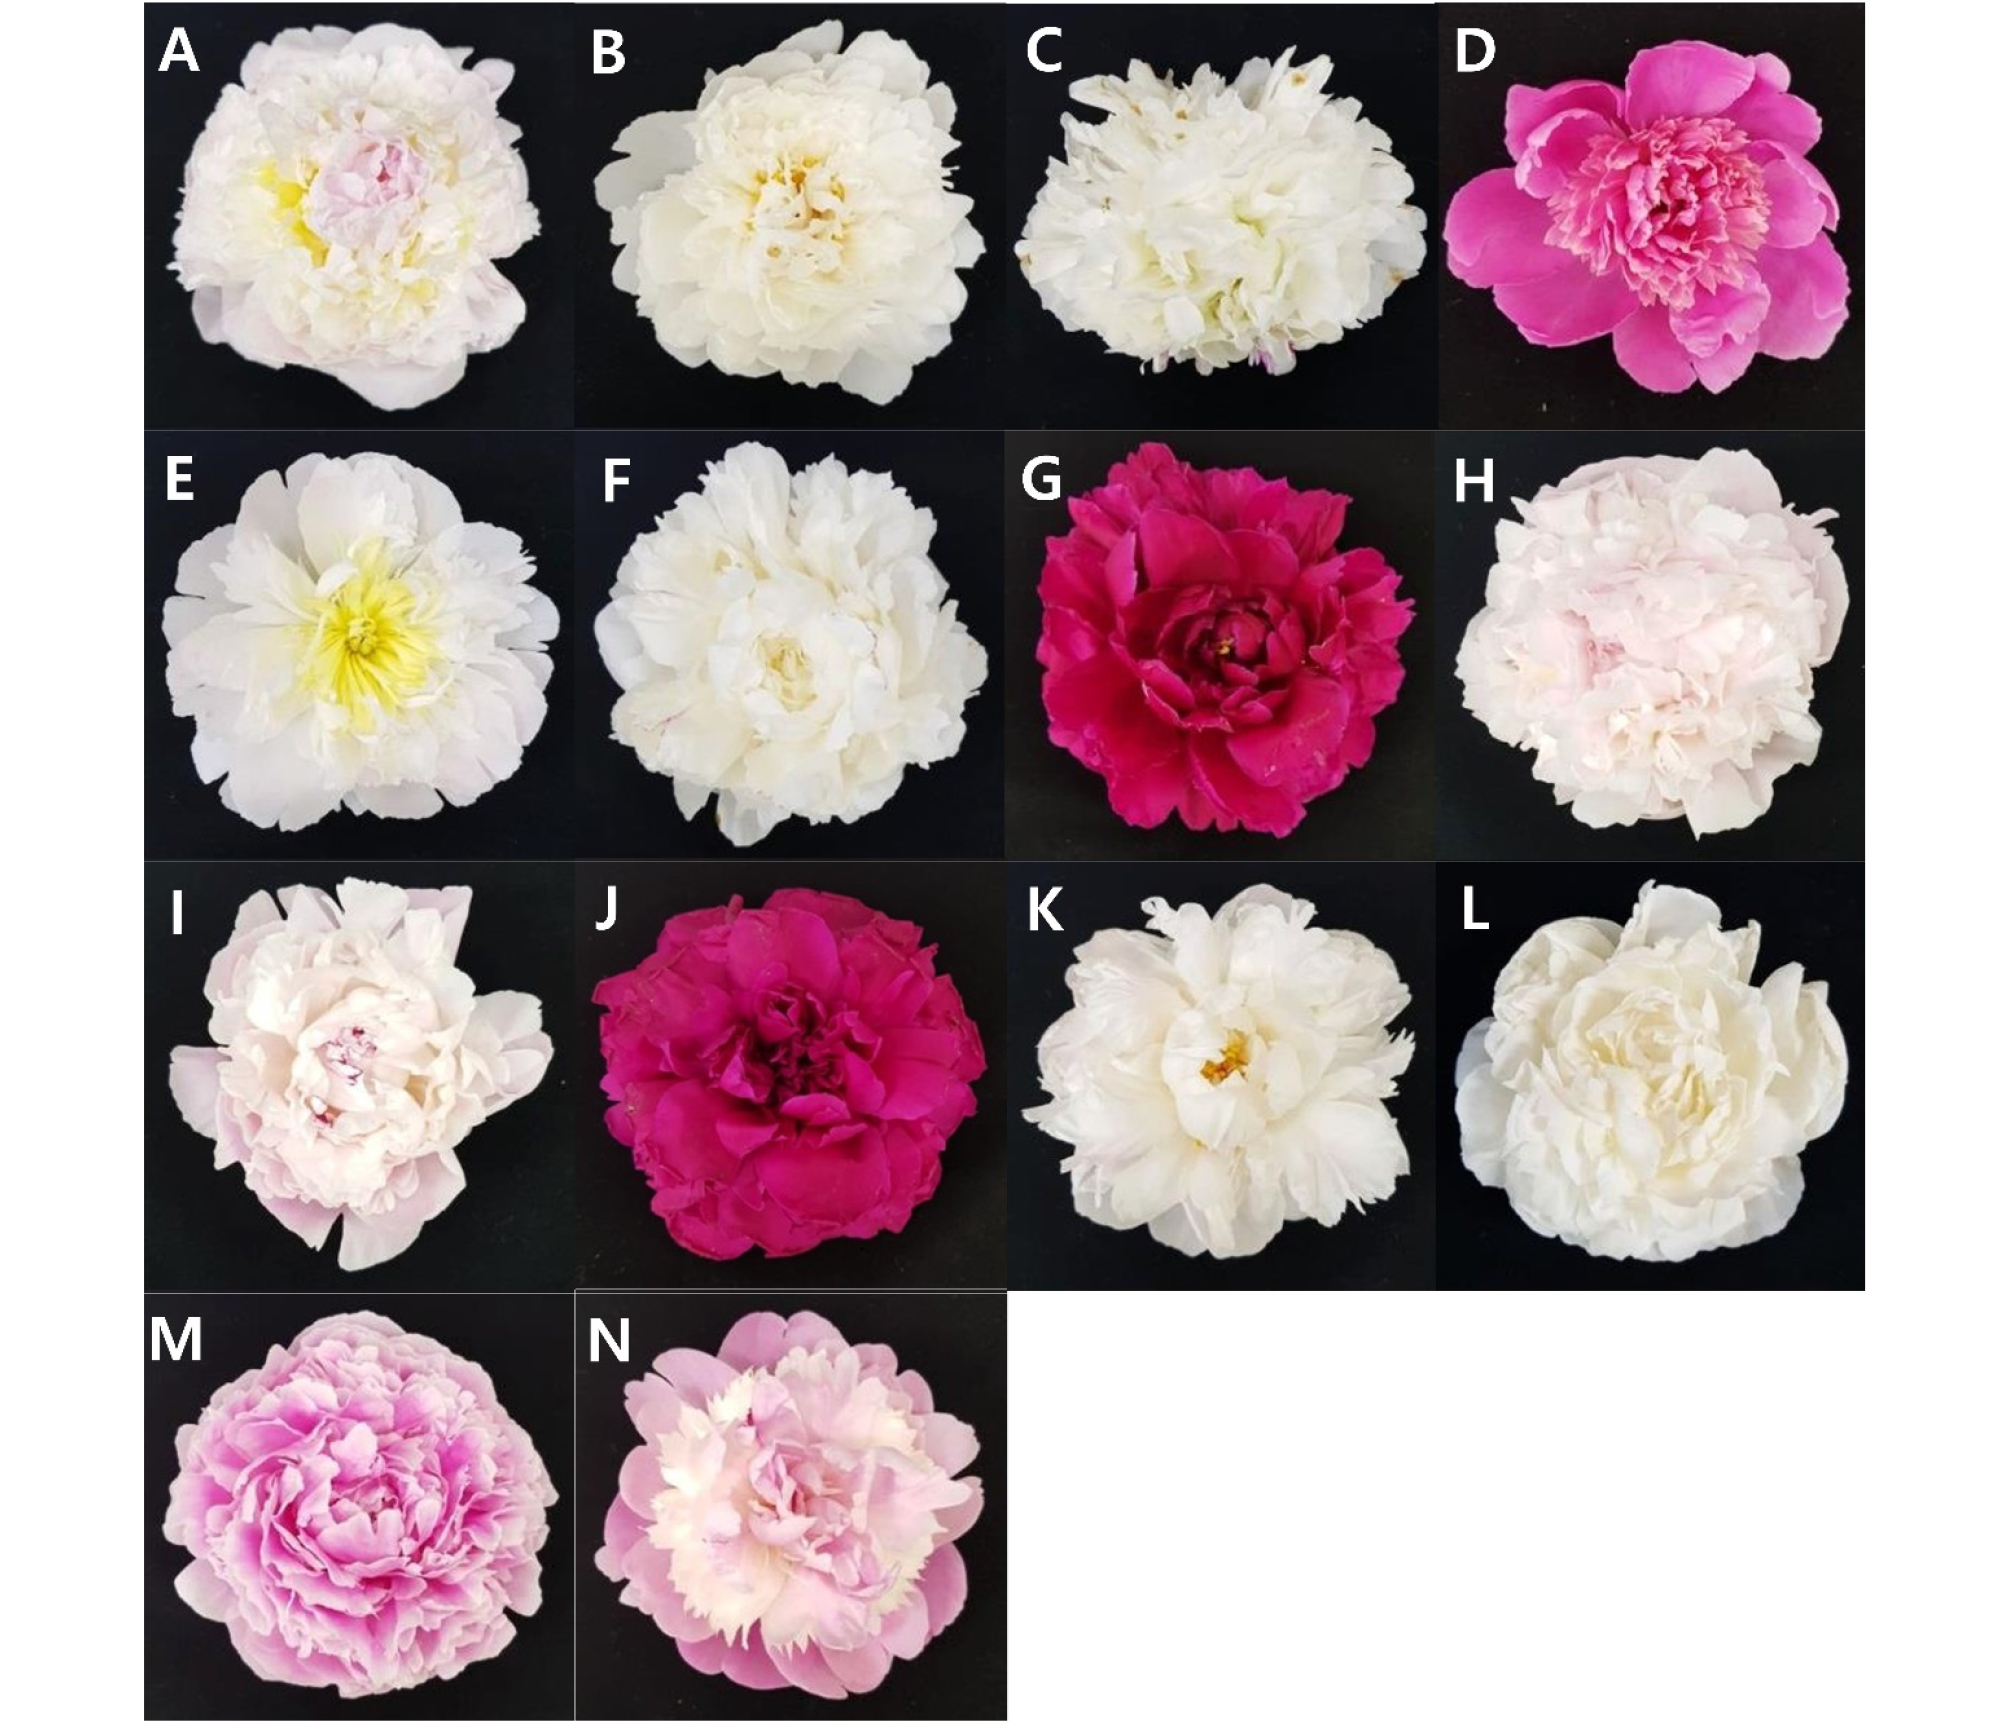
Fig. 1.
Cut flowers of 14 cultivars of P. lactiflora at full bloom stage. (A) Blush queen, (B) Bowl of cream, (C) Jubilee, (D) Peter brand, (E) Honey gold, (F) Snow mountain, (G) Ole faithful, (H) Florence Nichols, (I) Nick Shaylor, (J) Paul M. wild, (K) Allan rogers, (L) Elsa sass, (M) Sarah bernhardt, (N) Taebaek.
E-nose analysis
An Alpha MOS FOX-2000 E-nose (Alpha MOS, Toulouse, France) equipped with 6 metal oxide sensors (Alpha MOS, Toulouse, France) was used to analyze floral scent. Based on sensor coating materials, the metal oxide sensors of Alpha MOS FOX-2000 were the P and T sensors as n-type semiconductors. Each sensor can detect different volatile compounds and reflect the concentration of specific compounds (P10/1 and P10/2, non-polar volatiles; PA2 and T30/1, organic solvents; P40/1, fluoride or chloride; T70/2, food flavors and volatile compounds) (Alpha MOS, 1998).
Petals were detached from each flower of 14 peony cultivars for E-nose analysis. 1 mg of each fresh flower petals was weighed and transferred into a 20 ml vial with screw cap. These vials were then placed in the auto-sampler (HS-100, CTC Analytics, France). To obtain maximum sensor responses, the analytical conditions for the E-nose operation were optimized for the flower samples as shown in Table 2.
In this system (Table 2), a dry air carrier gas flow was set to a constant flow of 150 ml/min. The vials were then incubated at 40°C for 2min and agitated at 500 rpm (on, 5s; off, 2s). Under these conditions, floral volatiles migrate into the headspace and are sent to the sensor via an auto sampler. The statistical program Alpha Soft (V12.45; Alpha MOS, Toulouse, France) was used for the instrument control and data processing. Analyses were performed using the chemical sensitivity from 6 metal oxide semi-conductors (MOS) (Delta Rgas/Rair), which is the change in the rate of resistance readings during the vapor exposure of each sensor (Kim et al., 2016). The interpretation of the data from the E-nose was accomplished using multivariate statistical technique, including PCA and DFA. Also, hierarchical clustering analysis (HCA) was performed to statistically analyze the comprehensive relationship contained in PCA and DFA score data from each sample.
Table 2. Analytical conditions for E-nose operation
FT-IR spectroscopic analysis
Petals of peony cut flower samples from 14 individual cultivars were collected, freeze-dried, ground into powder, and stored at -70°C before analysis. Crude extracts were obtained for FT-IR analysis. Two hundreds ㎕ of extraction buffer [20% (v/v) methanol] was added to 20 ㎎ of peony petal powder, mixed vigorously and incubated at 50°C for 20 min with occasional vortex. Mixture was centrifuged at 13,000 rpm for 10 min, and supernatant was transferred to a new 1.5 ㎖ microcentrifuge tube. Centrifugation was repeated until cell debris was completely removed. This crude extract from peony petals was temporarily stored at -20°C prior to FT-IR spectroscopy analysis.
To obtain spectra from a FT-IR spectrometer (Tensor 27, Bruker Optics GmbH, Ettlingen, Germany) equipped with a deuterated triglycine sulfate (DTGS) detector, 5 ㎕ of whole-cell extract was loaded onto a pre-warmed 384-well silicon plate at 37°C. After drying the sample, the silicon plate was placed into the microplate reader unit HTS-XT (Bruker Optics GmbH, Ettlingen, Germany). All FT-IR spectra were acquired using OPUS software (version 6.5; Bruker, Ettlingen, Germany). Each spectrum was scanned in 4,000-400 ㎝-1 with a spectral resolution of 4 ㎝-1. For the improvement of the signal-to-noise ratio, 128 interferograms were co-added and averaged with the analytical results. Infrared spectra were obtained by subtraction of the plate spectra (background) used for deposition of the samples. For multivariate analysis, the original digital FT-IR spectra were pre-processed by correction for baseline, normalization of spectral intensity and smoothing using OPUS program (version 6.5; Bruker, Ettlingen, Germany) and derivatives (differentiation) using the Python (version 2.7.15; Python Software Foundation, www.python.org). After a data preprocessing, spectral data was then subjected to multivariate analysis.
For multivariate analysis, the 1,800-800 ㎝-1 region (the fingerprint region) of the FT-IR spectral data (instead of full spectrum) was subjected to PCA, PLS-DA and HCA. The generated FT-IR spectral data after differentiation, were imported into R program (version 3.5.1). PCA was conducted according to the non-linear iterative partial least squares (NIPALS) algorithm (Wold, 1966). PLS-DA was also conducted using R program for more discrete clustering of metabolic variation in flowers of different peony cultivars according to a supervised pattern recognition method maximizing the separation among samples. To find more significant FT-IR variables for metabolic variation among the 14 cut peony cultivars, PCA loading values were also examined. Also, HCA dendrogram was performed to statistically analyze the comprehensive relationship contained in PCA and PLS-DA score data from each sample using R program.
Results and Discussion
Morphological characteristics
Morphological analysis including flower and leaf characteristics was evaluated in 14 cut peony cultivars (Fig. 1 and Table 1). All the characteristics showed a considerable variation among the P. lactiflora cultivars. Flowering time of all cultivars was between the beginning and mid of May. ‘Blush queen’, ‘Bowl of cream’, ‘Ole faithful’, and ‘Florence nichols’ showed a longer leaf length (>13 ㎝). And ‘Ole faithful’, ‘Nick shaylor’, ‘Snow mountain’, and ‘Elsa sass’ showed a longer leaf width (>5 ㎝). ‘Ole faithful’ showed longer leaf length and leaf width. ‘Honey gold’, ‘snow mountain’, ‘Ole faithful’, ‘Bowl of cream’ and ‘Peter brand’ showed larger flower diameter (>15 ㎝). And ‘Ole faithful’, ‘Paul M. wild’, ‘Bowl of cream’, ‘Blush Queen’ and ‘Jubilee’ showed taller flower height (>75 ㎝). Flower stem diameter was larger (>9 ㎜) in ‘Ole faithful’, ‘Snow mountain’, ‘Bowl of cream’, ‘Blush queen’ and ‘Florence nichols’. ‘Ole faithful’ and ‘Bowl of cream’ showed higher values of flower diameter, flower height, and flower stem diameter. Most characteristics of ‘Taebaek’ cultivar is similar to those of ‘Sarah bernhardt’ (leaf length, leaf width, flower diameter, flower height, flower stem diameter), but the flower type was unique compared to ‘Sarah bernhardt’ and other cultivars. As a result of breeding, peony has various flower types and colors. Based on the petal morphology, flower forms of peony are characterized into 6 types including single, Japanese, anemone, bomb, semi-double, and double. (Kamenetsky and Dole, 2012). Most peonies used for the evaluation of characteristics have a double type and single-tone flower but ‘Taebaek’ has an anemone type and two-tone flower. The quality of cut flowers is dependent on color of flowers, flower height, the shape of flower, etc. (Kim et al., 2012). Therefore, these characteristics related to flower size or type are highly important to develop new breeding lines and a variety of materials in the floral industry.
Discrimination of floral scents among peony cultivars using E-nose
Floral scents of 14 cut peony cultivars were investigated by multivariate statistical analysis of E-nose sensor data (Fig. 2). To reduce the dimension of original data, fractional was used. PCA method reduces the complexity of the data from the initial high dimensions to low dimensions. A PCA score plot of E-nose data from peony cultivars was displayed in a two-dimensional plot using first two principal components (PC1 and PC2), which accounted for 97.2% and 2.5% (99.7% total) of total variation (Fig. 2A). PCA plot showed that most flower samples belonging to the same cultivar segregated into envelopes presenting that floral scents of peony are distinguished in a cultivar dependent manner. Especially, the scent pattern of ‘Honey gold’, ‘Allan rogers’, ‘Nick shaylor’, ‘Sarah bernhardt’, and ‘Florence nichols’ clearly separated from the other cultivars in both PC1 and PC2, respectively. This result implies that floral scents of these cultivars have a distinctive characteristic compared to the other cultivars. Korean cultivar ‘Taebaek’ is grouped together with ‘Jubilee’ on the PCA score plot (Fig. 2A). This indicates that the peony cultivars were distinguished according to the floral scent variations.
It was observed that most of the E-nose sensors were responsive to all cultivars (Fig. 2C). Especially, the most significant signals were observed in 3 sensors, including PA/2, T30/1 and T70/2 sensors. These sensors reflect the concentration of specific compounds such as organic solvents, food flavors and volatile compounds. The sensor signals of both P10/1 and P40/1 were also high. These sensors detect non-polar volatiles and fluoride or chloride (Alpha MOS, 1998). Considering these results, we suggest that the characteristic variations corresponding to organic solvents, food flavors and volatile compounds as well as non-polar volatiles and fluoride or chloride were the important variation factors among the cultivars.
The DFA score plot developed from the same data that provided the PCA score plot is presented in Fig. 2A. A DFA score plot was displayed in a two-dimensional plot defined by the first two discriminant functions (DF1 and DF2), which accounted for 71.4% and 26.1% (97.6% total) of total variation (Fig. 2B). As the score plot is similar to the PCA result, the discrimination was confirmed, as all samples from the same cultivars are grouped. However, it also indicated that differences between some cultivars are small in the DFA score plot. DFA score plot showed that most cultivars were located at the light panel of the DF1 score plot, whereas there ‘Allan rogers’ was located at the center of DFA and ‘Honey gold’ was located at the left panel of the DF1 plot. Although most cultivars were placed at same panel in DF1 plot, these cultivars were distinguished into some groups based on DF2 plot.
To compare the scent intensity of flowers in different cultivars, distances between flowers and the blank control were used (Alpha MOS, 1998; Kim et al., 2016). Euclidean distances between centroid of three replicates of flower sample and the control were extracted using Alpha Soft (Version 12.45.) and was used to compare the relative intensities among the floral scents of 14 different peony cultivars. The distance analysis showed that all cultivars have a different relative intensity of scent according to the sensory evaluation (Fig. 2D). The highest intensity was observed in ‘Allan rogers’ cultivar followed by ‘Nick shaylor’ and ‘Old faithful’ cultivars, respectively. ‘Blush queen’ and ‘Paul M. wild’ showed lower intensity. ‘Allan rogers’ cultivar could be a suitable candidate to breed a new cultivar with strong floral scent and to develop new fragrances. Among all the cultivars exhibiting strong floral scents, ‘Ole faithful’ showed higher flower diameter, flower height and flower stem diameter (Table 1). The floral intensity of ‘Taebaek’ cultivar is similar to ‘Jubilee’ according to PCA and DFA score plot. Considering these results, we suggest that ‘Ole faithful’ has a good quality of ornamental resources and is highly beneficial in developing medicinal and cosmetic industrial products.
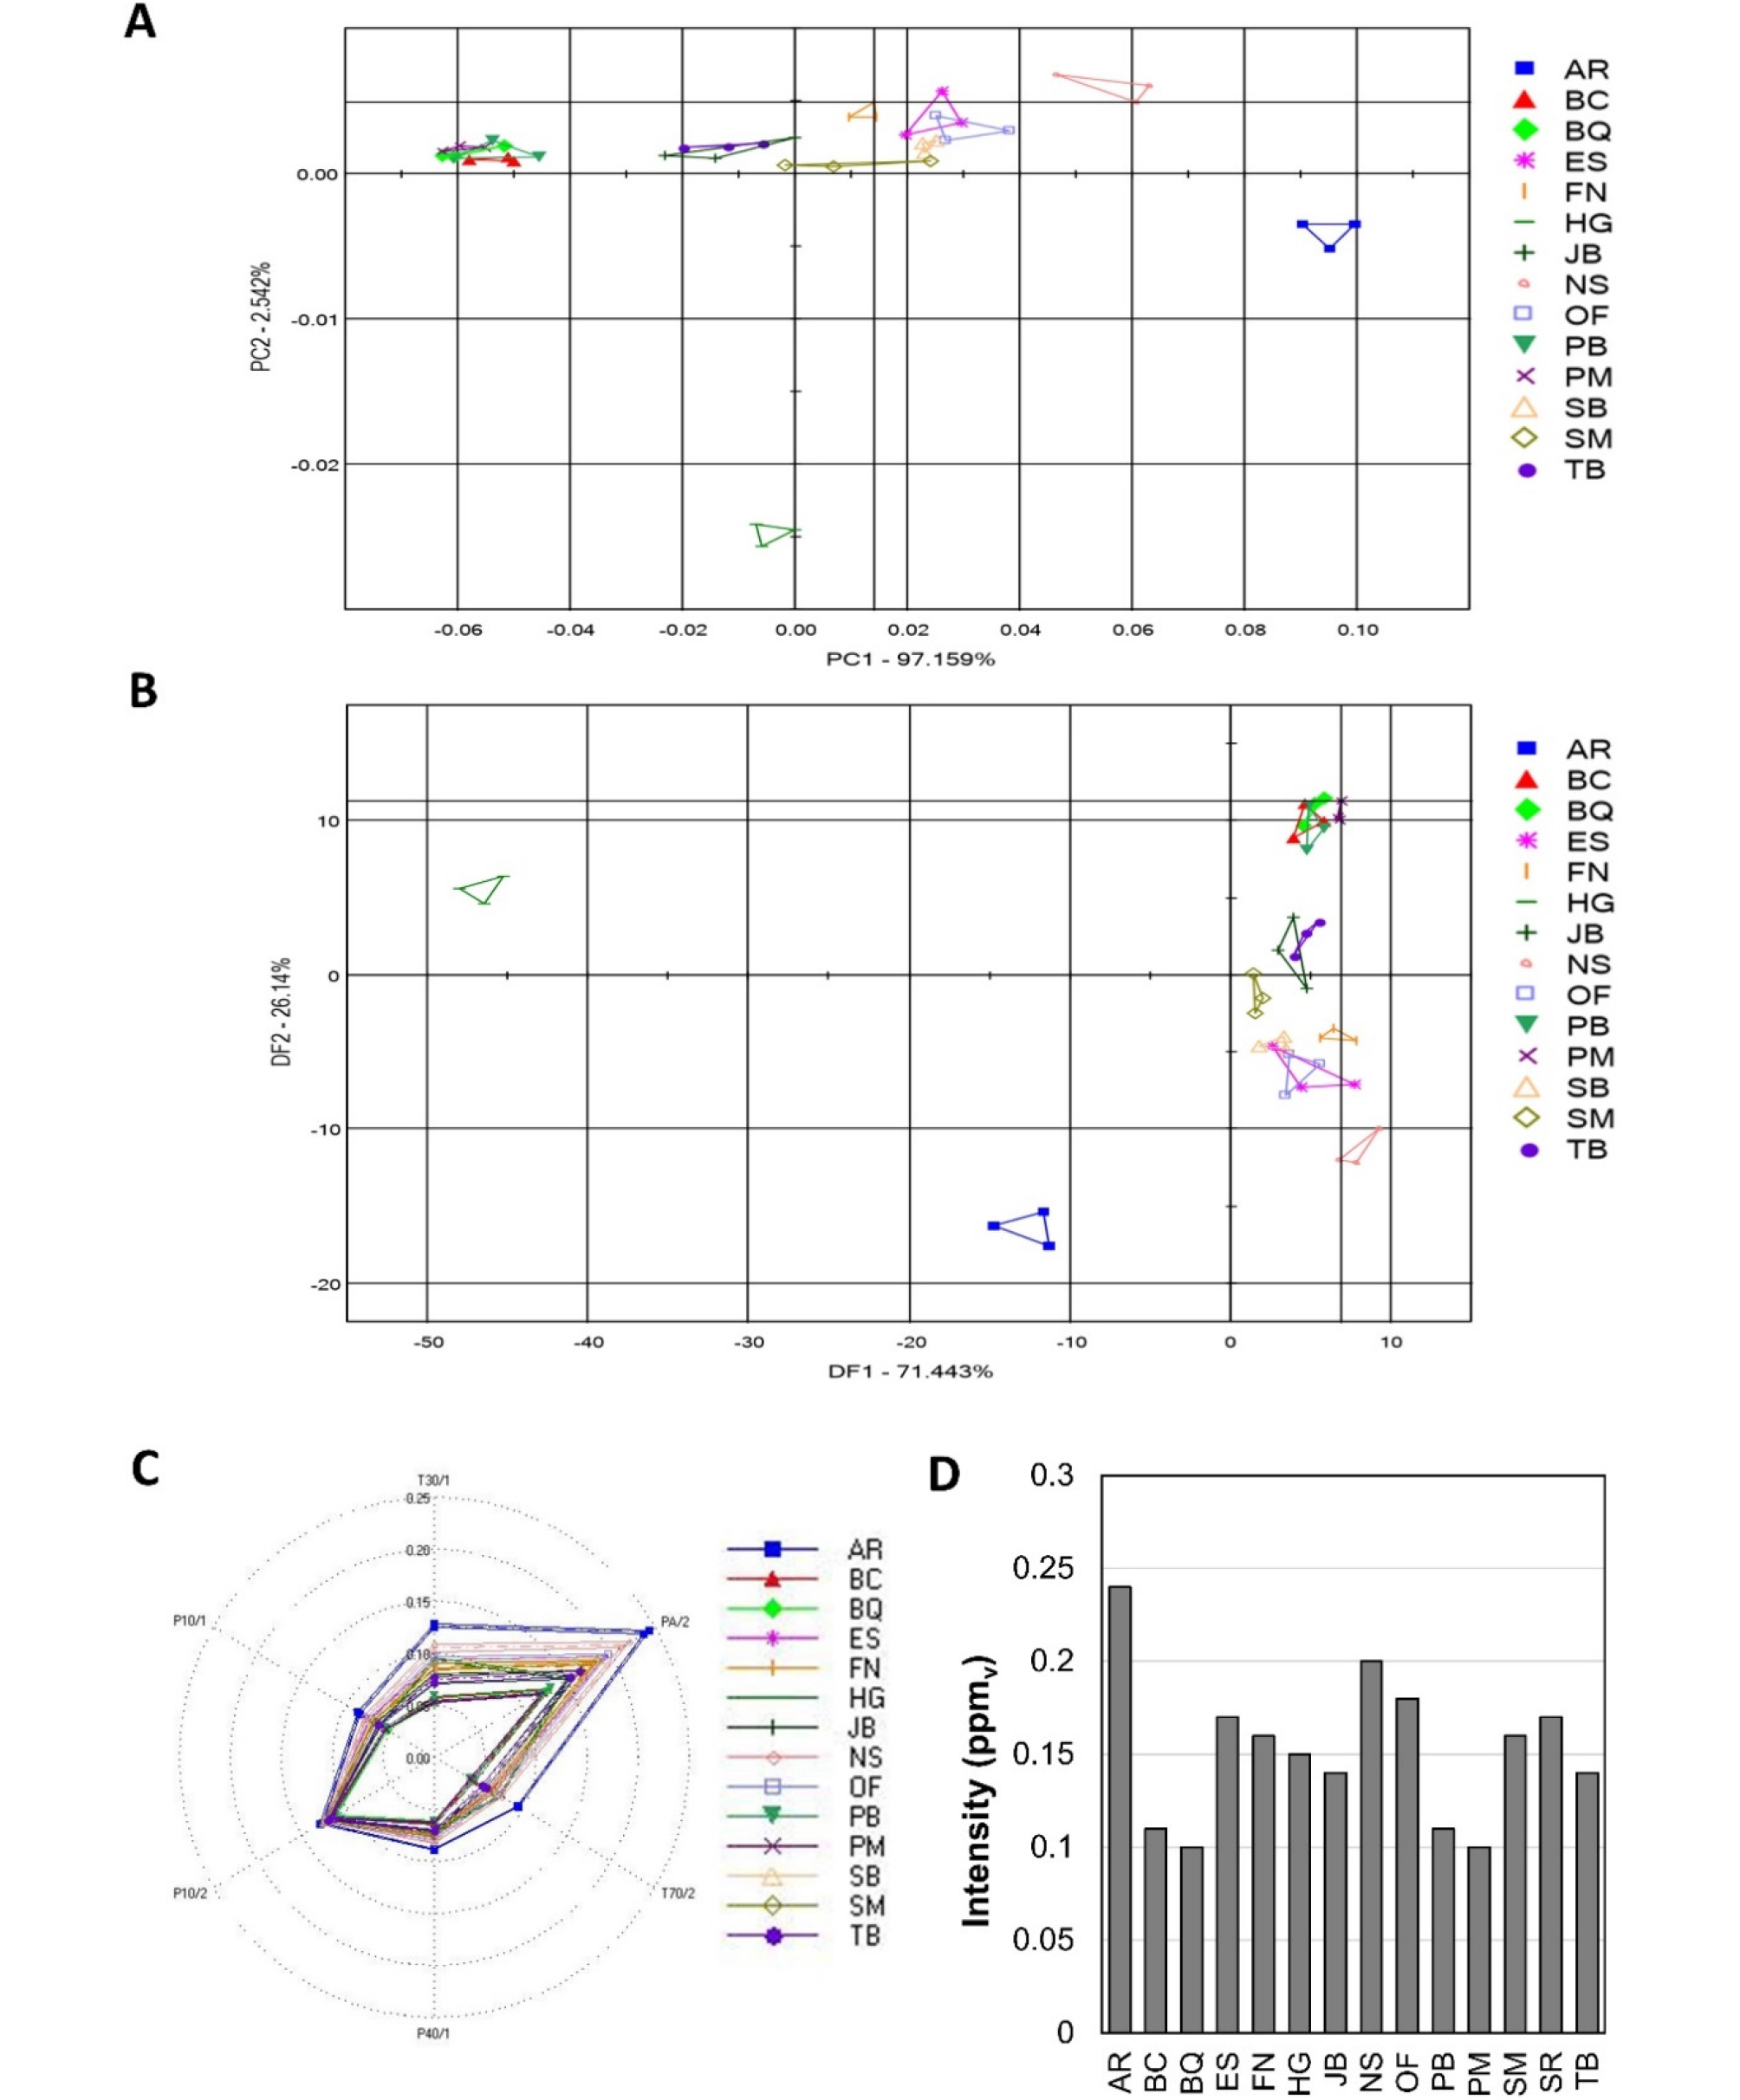
Fig. 2.
Floral scent analysis of different P. lactiflora cut flower cultivars using E-nose. (A) PCA, (B) DFA, (C) Radar Plot, (D) Intensity. AR, Allan rogers; BC, Bowl of cream; BQ, Blush queen; ES, Elsa sass; FN, Florence nichols; HG, Honey gold; JB, Jubilee; NS, Nick Shaylor; OF, Ole faithful; PB, Peter brand; PM, Paul M. wild; SB, Sarah bernhardt; SM, Snow mountain; TB, Taebaek.
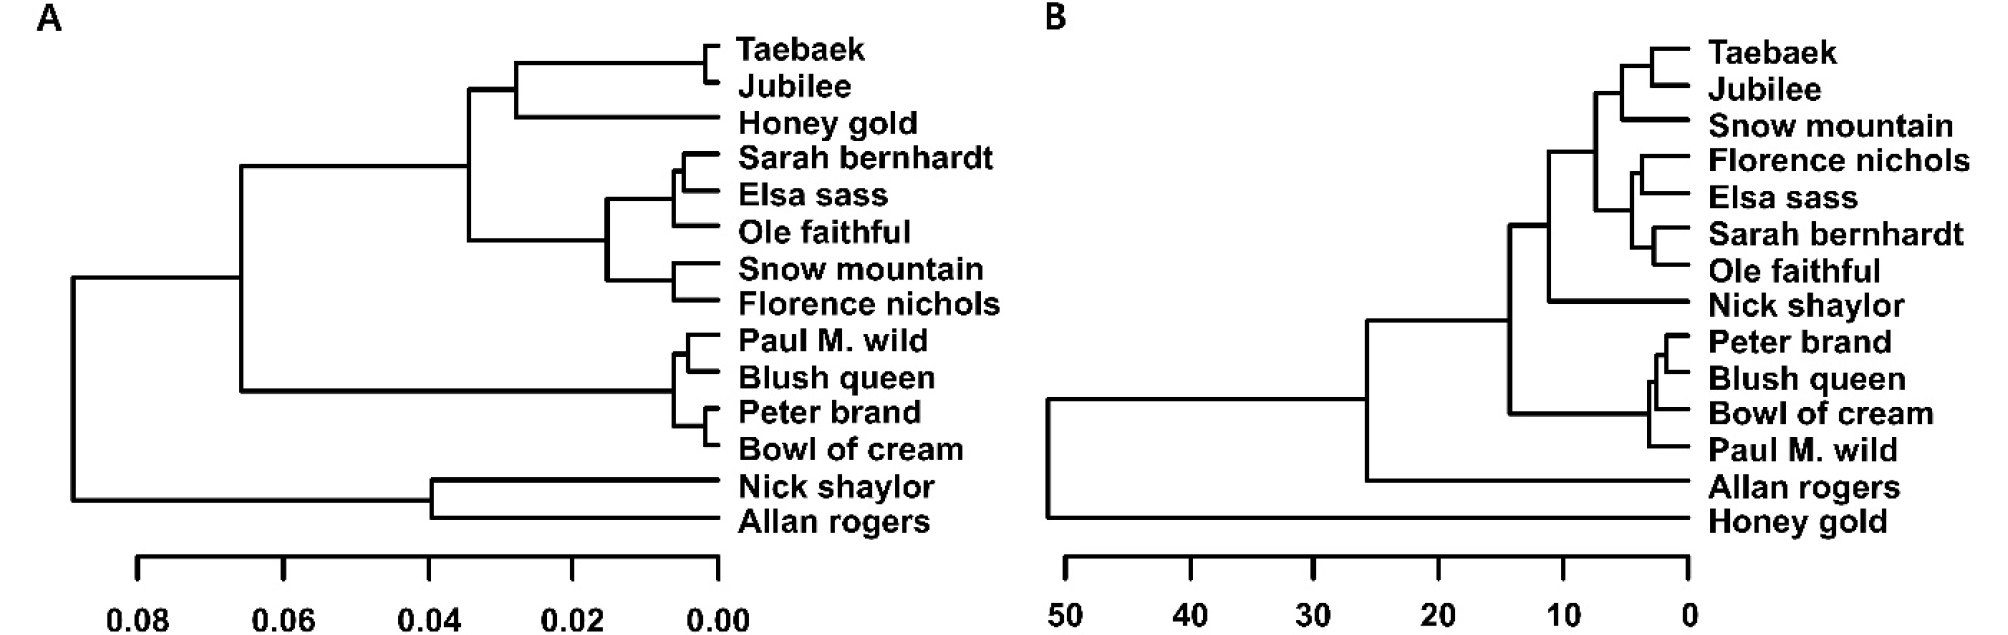
A hierarchical dendrogram based on PCA of the E-nose data showed that the 14 categories of peony cultivars were separated into two major groups (Fig. 3A). The first major group consisted of ‘Nick shaylor’ and ‘Allan rogers’ and the second major group consisted of the others (12 cultivars) including 2 subgroups. The HCA dendrogram from DFA of the E-nose data is shown in Fig. 3B. The HCA dendrogram based on DFA separated the 14 peony cultivar lines into two major groups except for ‘Honey gold’ and ‘Allan rogers’ that were outlined. Both HCA dendrograms from PCA and DFA showed that there were 3 groups including same cultivars. Among 3 groups, the first group consisted of ‘Paul M. wild’, ‘Blush queen’, ‘Peter brand’, and ‘Bowl of cream’. The second group consisted of ‘Sarah bernhardt’, ‘Elsa sass’, ‘Ole faithful’, and ‘Florence nichols’. The third group consisted of ‘Taebaek’ and ‘Jubilee’. These results indicate that cultivars belonging to the same group have similar volatile compounds compared to the other cultivars. The overall results from PCA and DFA showed that the 14 cultivars of peony flower samples could be clustered according to their floral scent profiles. PCA and DFA also indicated that a discriminating pattern was not found between P. lactiflora cultivars and its hybrid cultivar ‘Old faithful’. This result indicates that the metabolic changes depending on the cultivar were much greater than those depending on the hybridization. This further implies that the variations in common floral volatile compounds present in peony could discriminate different cultivars.
Discrimination of metabolites among peony cultivars using FT-IR spectroscopy
The FT-IR spectroscopy combined with multivariate analysis was performed to identify different cut peony cultivars. Quantitative FT-IR spectra from peony cultivars are shown in Fig. 4A. The most significant spectral variation among the 14 peony cultivars was observed in amide I and II of amino acid and protein (1,750-1,500 ㎝-1), phospholipid/DNA/RNA (1,500-1,200 ㎝-1) and carbohydrate (1,150-950 ㎝-1) regions (Parker, 1983). These FT-IR spectral variations from flowers indicate that there were qualitative and quantitative metabolic differences between the cultivars of peony. A PCA score plot of the FT-IR data from 14 peony cultivars was displayed in a two-dimensional plot using the first two principal components (Fig. 4B), which accounted for 49.7% and 20.5% (70.2% total) of the total variation. A PCA score plot showed that most cut flower samples belonging to the same cultivar segregated into a group. In particular, ‘Ole faithful, ‘Paul M. wild’ and ‘Taebaek’ were clearly discriminated based on different metabolites. These results indicate that these cultivars have significant differences at metabolite level compared to the other cultivars. However, there were few overlaps among some cultivars in PCA. An overlap between ‘Bowl of cream’, ‘Honey gold’ and ‘Sarah bernhardt’ was observed. Furthermore, ‘Peter brand’ and ‘Elsa sass’ were also overlapped on the PCA score plot which indicate that these cultivars have relatively high similarities at metabolite level. Identifying the spectral variables exhibiting the greatest variance of PC 1 and PC 2 scores for sample separation was possible using PCA loading values. PC score loading plots based on PCA data from peony cultivars are shown in Fig. 4C. Significant FT-IR spectral variables for determining PC 1 and PC 2 are mostly distributed in the 1,700-1,600 ㎝-1, 1,500-1,400 ㎝-1, 1,200-1,150 ㎝-1 and 1,050-950 ㎝-1 regions. The polypeptide and protein repeat units give rise to nine characteristic IR absorption bands (amide A, B, and I−VII). The amide I and II bands among them are the two most prominent vibrational bands of the protein backbone (Surewicz and Mantsch, 1988). The spectral region of amide I (C=O) band (1,700-1,600 ㎝-1) is sensitive to the protein secondary structural components (Kong and Shaoning, 2007). The spectral region of 1,500-1,300 ㎝-1 is specific to C-H bend of CH3 and P=O asymmetric stretching of phosphodiester group from nucleic acids and phospholipids. The vibrational bands related to carbohydrates are specific to the 1,200-900 ㎝-1 spectral region (C-O-C stretch, C-OH stretch, COH deformation, COC deformation, pyranose and furanose ring vibrations) (Zimmermann and Kohler, 2014). These results imply that the qualitative and quantitative metabolic differences corresponding to carbohydrates, phosphodiesters from nucleic acids and phospholipids and protein/amide I regions are the important metabolic variations among different peony cultivars.
A discriminating result of PLS-DA also showed the similar clustering patterns to PCA result (Fig. 4D). Peony samples belonging to the same cultivars were closely grouped into discrete clusters. Although overlaps of some cultivars were still observed in PLS-DA, ‘Ole faithful, ‘Paul M. wild’ and ‘Taebaek’ were clearly discriminated into different cultivars by PLS-DA similar to the result of PCA.
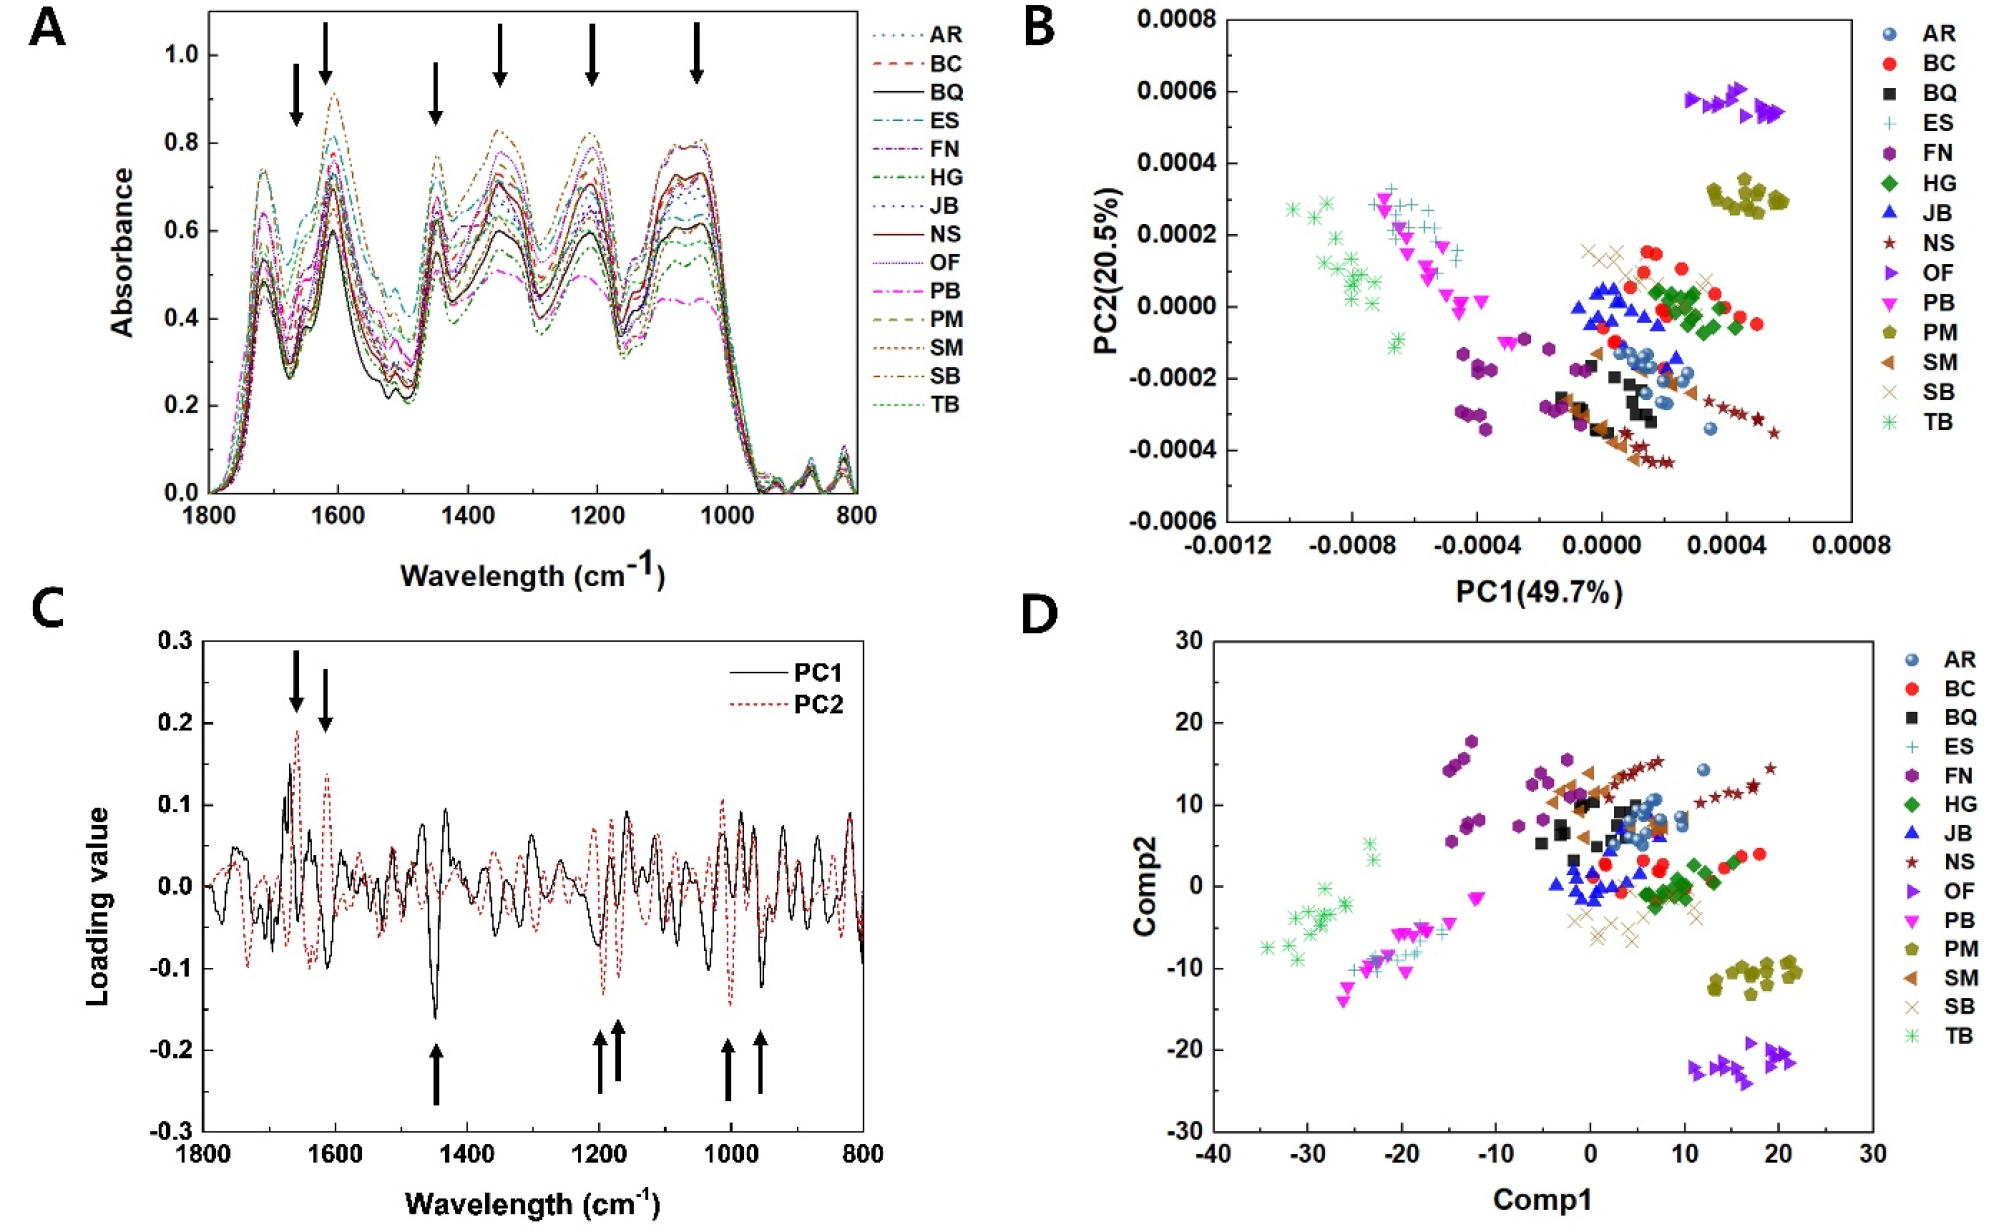
Fig. 4.
Multivariate analysis of FT-IR spectra from the flower extracts of P. lactiflora cut flower cultivars. (A) Representative FT-IR spectra from P. lactiflora cultivars. Arrows represent the FT-IR spectral regions showing significant variations among P. lactiflora cultivars. (B) PCA score plot devised from the FT-IR spectra of P. lactiflora cultivars. (C) PC loading values from the FT-IR spectra of P. lactiflora cultivars. Arrows represent significant spectral regions for determining PC 1 and 2 scores. (D) PLS-DA score plot of FT-IR data from P. lactiflora cultivars. AR, Allan rogers; BC, Bowl of cream; BQ, Blush queen; ES, Elsa sass; FN, Florence nichols; HG, Honey gold; JB, Jubilee; NS, Nick Shaylor; OF, Ole faithful; PB, Peter brand; PM, Paul M. wild; SB, Sarah bernhardt; SM, Snow mountain; TB, Taebaek.
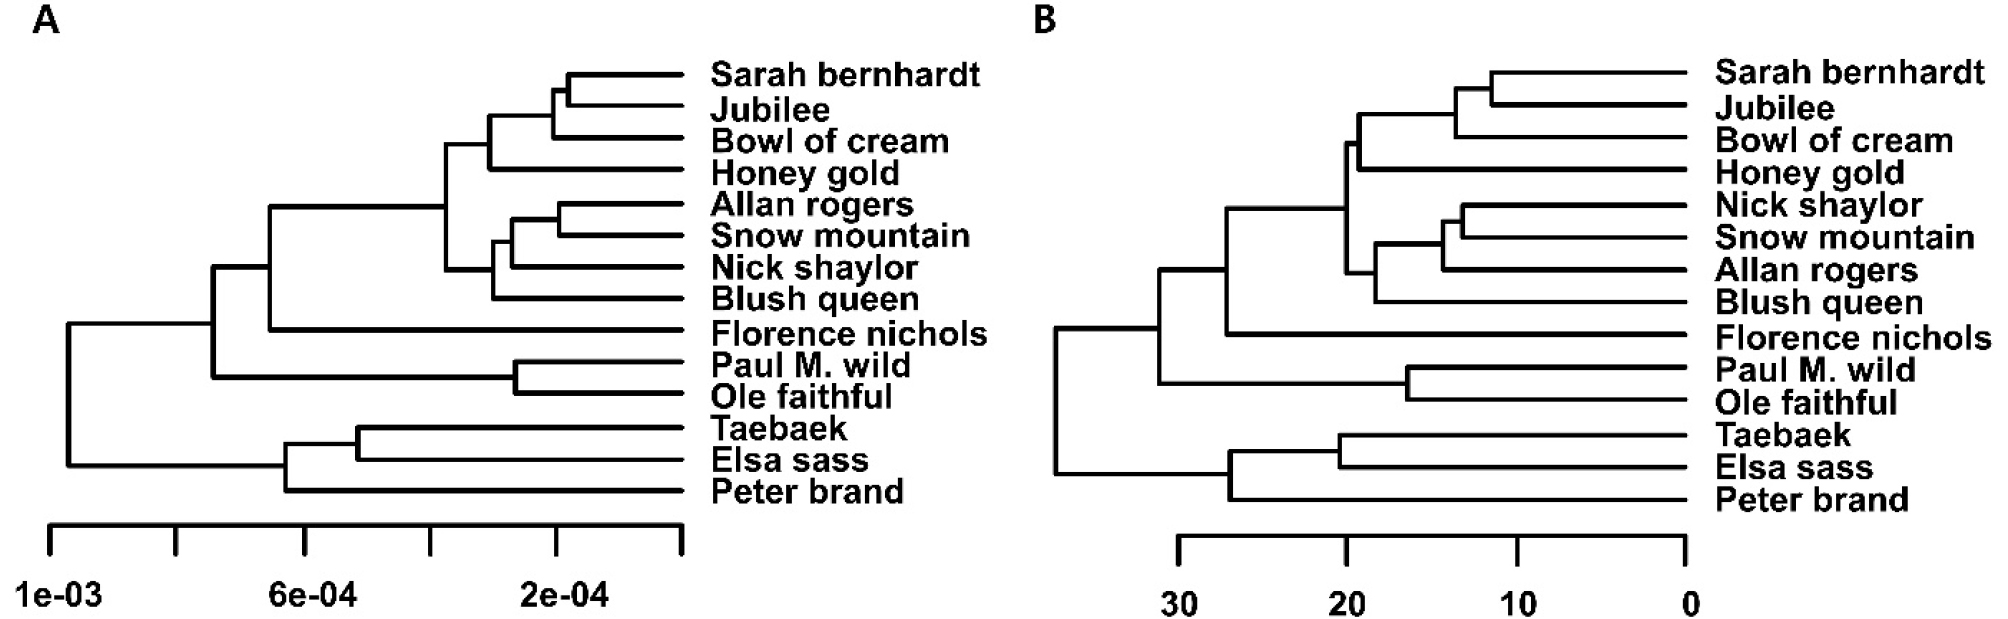
The HCA dendrogram from PCA and PLS-DA of the FT-IR spectral data showed that the 14 categories of peony cultivars were separated into two major groups (Fig. 5A and 5B). The first major group consisted of majority cultivars (11 cultivars) including 2 subgroups. The first subgroup consisted of 9 cultivars and was separated into 2 branches except ‘Florence nichols’. The first branch consisted of ‘Sarah bernhardt’, ‘Jubilee’, ‘Bowl of cream’ and ‘Honey gold’ and the second branch consisted of ‘Allan rogers’, ‘Snow mountain’, ‘Nick shaylor’ and ‘Blush queen’. The second subgroup was composed of ‘Paul M. wild’ and ‘Ole faithful’. The second major group consisted of ‘Taebaek’, ‘Elsa sass’ and ‘Peter brand’. The results of PCA dendrogram are similar to PLS-DA dendrogram, although the arrangement of second branch in PCA dendrogram is different compared to PLS-DA dendrogram. Both PCA and PLS-DA also could not show a discriminating pattern between P. lactiflora cultivars and its hybrid cultivar ‘Old faithful’, similar to the results of floral scent. The overall results from PCA and PLS-DA showed that the 14 cultivars of peony flower samples formed a cluster in a cultivar dependent manner at metabolite level. In addition, metabolite pattern of Korean ‘Taebaek’ is precisely discriminated in this study although the ‘Taebaek’ was overlapped with ‘Jubilee’ on the PCA and DFA of floral scent analysis. This result presents that the metabolic profile of ‘Taebaek’ has a distinctive characteristic compared to the other cultivars.
Similarity between the spectral differences of metabolites could be used not only for cultivar identification in higher plants (Kong et al., 2013; Carvalho et al., 2017) but also for the rapid comparison of metabolic equivalence from medicinal plants and their adventitious roots (Ahn et al., 2015). Therefore, the discrimination of peony cultivars based on the similarity of FT-IR spectral data could be explained by their metabolic similarity.
In conclusion, this study showed that E-nose and FT-IR combined with multivariate analysis was able to discern the differences of metabolites in peony cut flowers in a cultivar dependent manner. Also, we suggest that the differences of amide I and phospholipid region from FT-IR spectral data as well as floral scent data of T30/1, PA/2 and T70/2 sensors from E-nose could be used as metabolic markers to discriminate and characterize the chemotypes of different peony cultivars. Moreover, we showed that the variations of Korean ‘Taebaek’ from the imported cut peonies could be determined based on fragrance and metabolic compounds by E-nose and FT-IR combined with multivariate analysis. The information about diversity and conservation of plant resources is important to provide a chance for breeders to develop new cultivars and improve existing cultivars with useful characteristics (Ali et al., 2017). Therefore, these results could be applied in the breeding of new peony cultivars in floricultural industry and for the development of industrial materials in the perfume and cosmetics industry.
