

Introduction
Materials and Methods
Plant material and DNA extraction
PCR amplification
Data analysis of genetic diversity and population structure
Results
Allelic diversity of SSR marker
Establishment of genetic diversity and phylogenetic relations
Population structure
Principal coordinate analysis
Discussion
Introduction
Sunflower belongs to the genus Helianthus of the family Asteraceae, which is a diverse and large family of flowering plants. Sunflower, Helianthus annus L., is an important agricultural crop in most sunflower growing countries that produces edible oils, that is estimated as a12% of global oil production of vegetable oils worldwide. It takes position four after palm oil, soybean and canola in vegetable oil production (Rauf et al., 2017). Oil from sunflower is considered a healthy option to vegetable oils, because it has high content of polyunsaturated fatty acids with 55-60 percent of linoleic acids and 25-30 percent of oleic acids, which helps in reduction of cardiac related problems.
The sunflower plant is a major oil crop and belongs in a crop rotation system in South-West Kenya due to growing well under drought condition compared with other crops in tropical semi arable condition. The sunflower crop has various varieties, but two main types are exists as tall and dwarf in Kenya. The tall varieties are open pollination as a landrace or inbred line and can grow to 1.5-2.4 m. The most grown tall varieties are Hungarian white, Kenya fedha, Kenya shaba, Record and Grey stripped. The most commonly local dwarf varieties are normally hybrids and grow to 1.2m with smaller head. The efficiency of hybrid breeding programs could be augmented, if the inbred lines could be assessed and superior crosses predicted before field evaluation (Melchinger et al., 1991). Open-pollinated and composite populations and inbred lines are main resources for sunflower breeding programs in Kenya. Therefore, evaluation of genetic diversity of such parental lines using molecular markers is important in sunflower breeding for successful exploration, genetic stability and enhanced heterotic effect in the available germplasm, because morphological characters are limited in number and unstable (Sahranavard et al., 2015).
Molecular markers play a major role in identifying variation in genomic DNA sequences. Polymorphism at molecular level in different species has played a major role in the analysis of genetic diversity, identification of phylogenetic relationships and also in transfer of target traits to elite germplasm using molecular linkage map in the aim of improving breeding activities. Different molecular markers have been used in mapping genes leading to development of sunflower linkage maps resulting in studies revealing genetic diversity in the genus Helianthus. Among The first molecular linkage maps was developed using Random Amplified Polymorphic DNA (RAPD) markers on wild sunflower (Rieseberg et al., 1993). There after other markers were generated and published using PCR based Restriction Fragment Length Polymorphic (RFLP) markers (Berry et al., 1995; Gentzbitel et al., 1995; Jan et al., 1998). Most of the sunflower linkage maps reported 17 linkage groups which represent the number of haploid chromosomes present in sunflower. Simple sequence repeats (SSR) marker resources have been developed for sunflower (Paniego et al, 2002; Yu et al., 2002; Gandhi et al., 2005; Pashley et al., 2006) and these markers were used to make new linkage maps (Tang et al., 2003a, Tang et al., 2003b; Dehmer and Fried, 2006) and expressed sequence tags (EST) - SSR, INDELS and single nucleotide polymorphism (SNP) markers were added on the already existing sunflower maps (Heesacker et al., 2008, Carla et al 2015). Recently, Badouin et al. (2017) published draft genome sequence of sunflower.
In case of genetic diversity analysis of crops, genomic- SSRs are more popularly used than EST-SSR markers due to the availability of markers, but the current trend towards the use of functional markers. ESTs derived markers have several fundamental advantages over genomic-SSRs according to embed in transcribed gene sequences. EST-SSR markers can be increase the efficiency to direct gene tagging for agronomical important traits by quantitative trait locus mapping and show a higher level of transferability to closely related species than genomic SSR markers (Gupta et al., 2003, Bhat et al., 2005). EST-SSR markers have been used in several studies, such as evaluation of genetic diversity in little millet (Ali et al., 2017), foxtail millet (Ali et al., 2016) and perilla (Song et al., 2015). Furthermore, if the hybrid inbred lines per se could be screened by molecular marker based genetic distance, prediction of heterosis can be possible to make superior crossing before field evaluation in sunflower breeding.
In Kenya, sunflower crop is more important in semi-dried area according to climate changes, because profits from growing sunflower with three months harvesting period are higher than those from traditional crops such as maize, sorghum and tobacco. Therefore, molecular characterization and estimation of the genetic diversity of genotypes that used in breeding are required to further improve the breeding programs. The present study was designed to estimate the level of genetic diversity in newly introduced sunflower lines through SSR markers.
Materials and Methods
Plant material and DNA extraction
Twenty four accessions, which consists of six landraces, two modern cultiva, ten restorers, four male sterilities and two female lines, were obtained from Kenya agricultural and livestock research organization (Table 1) and analyzed for genetic diversity using 32 EST-SSR and genomic-SSR markers (Table 2) that reported by Heesacker et al. (2008). Ten seeds of each accession were germinated and grown in the green house. The leaves were harvested at four-leaf stage after 10 days of planting and genomic DNA was extracted according to NucleoSpin Plant II Kit protocol (Macherey-Nagel, Germany). DNA quality and quantity were determined using a UV-Vis spectrophotometer micro plate reader (Biotech instrument, USA Ltd.) and visual comparison of 1% agarose gel electrophoresis. The extracted DNA was adjusted concentration at 50 ng/μL and stored at -20℃ for further use.
Table 1. A List of 24 sunflower inbred lines, restorer and Maintainers genotypes used in this study
Table 2. Information of 32 SSR primers used for analysis of 24 genotypes in this study
PCR amplification
Thirty two SSR markers (Table 2) that reported earlier by Heesacker et al. (2008) were used in this study to amplified the template DNA. The SSR primers were amplified in a 20 µL total volume containing 50 ng of genomic DNA, 2 µL of each SSR primers (10 pmol), 4 µL of 5x reaction Buffer (Inclone Co, Korea), 1 U of Taq DNA polymerase (Inclone Co, Korea), 1.6 µL of dNTP (2.5 mM), and 11 µL nuclease- free water. DNA amplifications were performed in PTC-100 thermal controller (MJ Research Watertown, MA, USA). The PCR profile was: initial denaturation of 3 min at 94℃, followed by 35 cycles of 45s at 50-55℃ and 45s at 72℃, and a final extension of 10 min at 72℃. PCR products of clear, stable and specific bands with and expected length (100-250 bp) were considered as successful PCR amplifications. All the amplifications were separated by capillary electrophoresis using Fragment AnalyzerTM 96-capillary Automated CE System using DNF-900 double stranded DNA Reagent Kit (Advanced analytical, USA) according to the manufacturer’s instruction. SSR alleles were visualized and scored using PROSize 2.0 software version 1.2.1.1 Kit (Advanced analytical, USA).
Data analysis of genetic diversity and population structure
Analysis for different parameters of variability such as number of observed alleles (NA), expected homozygosity (HO), expected heterozygosity (HE), and polymorphism information content (PIC) were calculated by Cervus 3.0 software (Araneda et al., 2004; Kalinowski et al., 2007). An unweighed pair group method with arithmetic mean (UPGMA) hierarchal clustering were carried using DARWin 6.0 (Perrier and Jaccquemond-Collet, 2006) to analyze the cluster.
Among clustering method algorithms, neighbors-joining method (Saitou and Nei, 1987) was used to clustering. Principle coordinate analysis (PCoA) was performed using GenAlex version 6.5 (Peakall and Smouse, 2012) with 999 times boost-strapping to analyze the molecular variance (AMOVA). Genetic structure was analyzed by STRUCTURE 2.3.4 (Pritchard et al., 2000) with 10 independent run and 100,000 Markov Chain Monte Carlo (MCMC) repetitions after a burn-in period of 100,000 interactions for each group number K. The actual number of subpopulations was determined by the logarithm of likehood for each K;Ln P (D) = L (K) and the optimum value ΔK was obtained by ΔK = [L’’ (K)]/ Stdev according to Evanno et al. (2005) as to determine the most likely number of groups.
Results
Allelic diversity of SSR marker
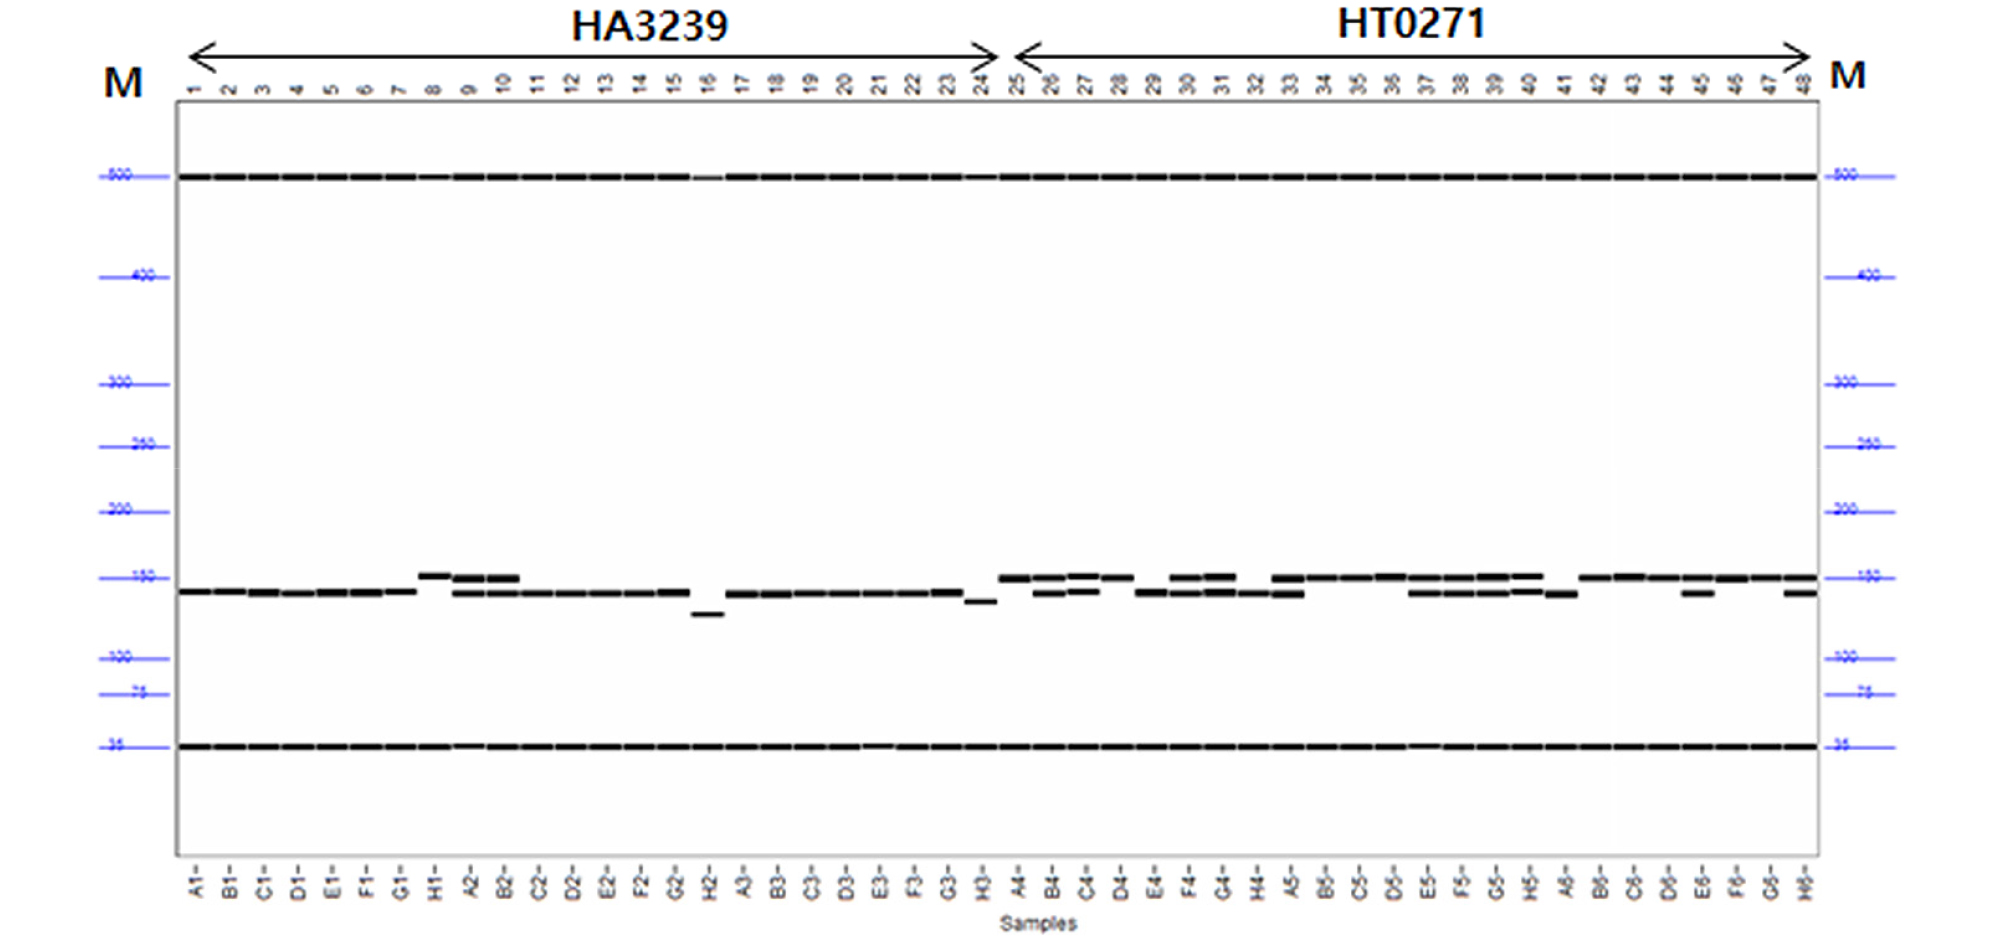
A total of 98 SSR primer pairs, which were earlier reported by Heesacker et al. (2008) to make the molecular genetic map of sunflower, were used to select the polymorphic primers about 24 Kenyan sunflower breeding lines. The 32 SSR primers were displayed clear and repeatable polymorphic bands on capillary electrophoresis (Table 2 and Fig. 1). A total number of 83 alleles were detected with an average of 2.5 alleles per locus. The number of polymorphic alleles ranged from two to seven in used sunflower accessions (Table 2). The HA1848 of genomic SSR marker recorded the highest number of alleles of the markers as seven polymorphic alleles, while two or four polymorphic alleles were observed in most of amplified product. The average value of polymorphic information content (PIC) for all the 32 polymorphic primers was 0.38 and PIC values ranged from 0.141 (HA77) to 0.788 (HA 1848). No heterozygosity deficiency (Ho) was observed quite low t the mean of 0.007. The value of expected heterozygosity (He) ranged from 0.156 (HA77 and HT0426) to 0.830 (HA 1848) with a mean of 0.461. The selected SSR markers were showed some high level of polymorphism in the genetic parameters.
Establishment of genetic diversity and phylogenetic relations
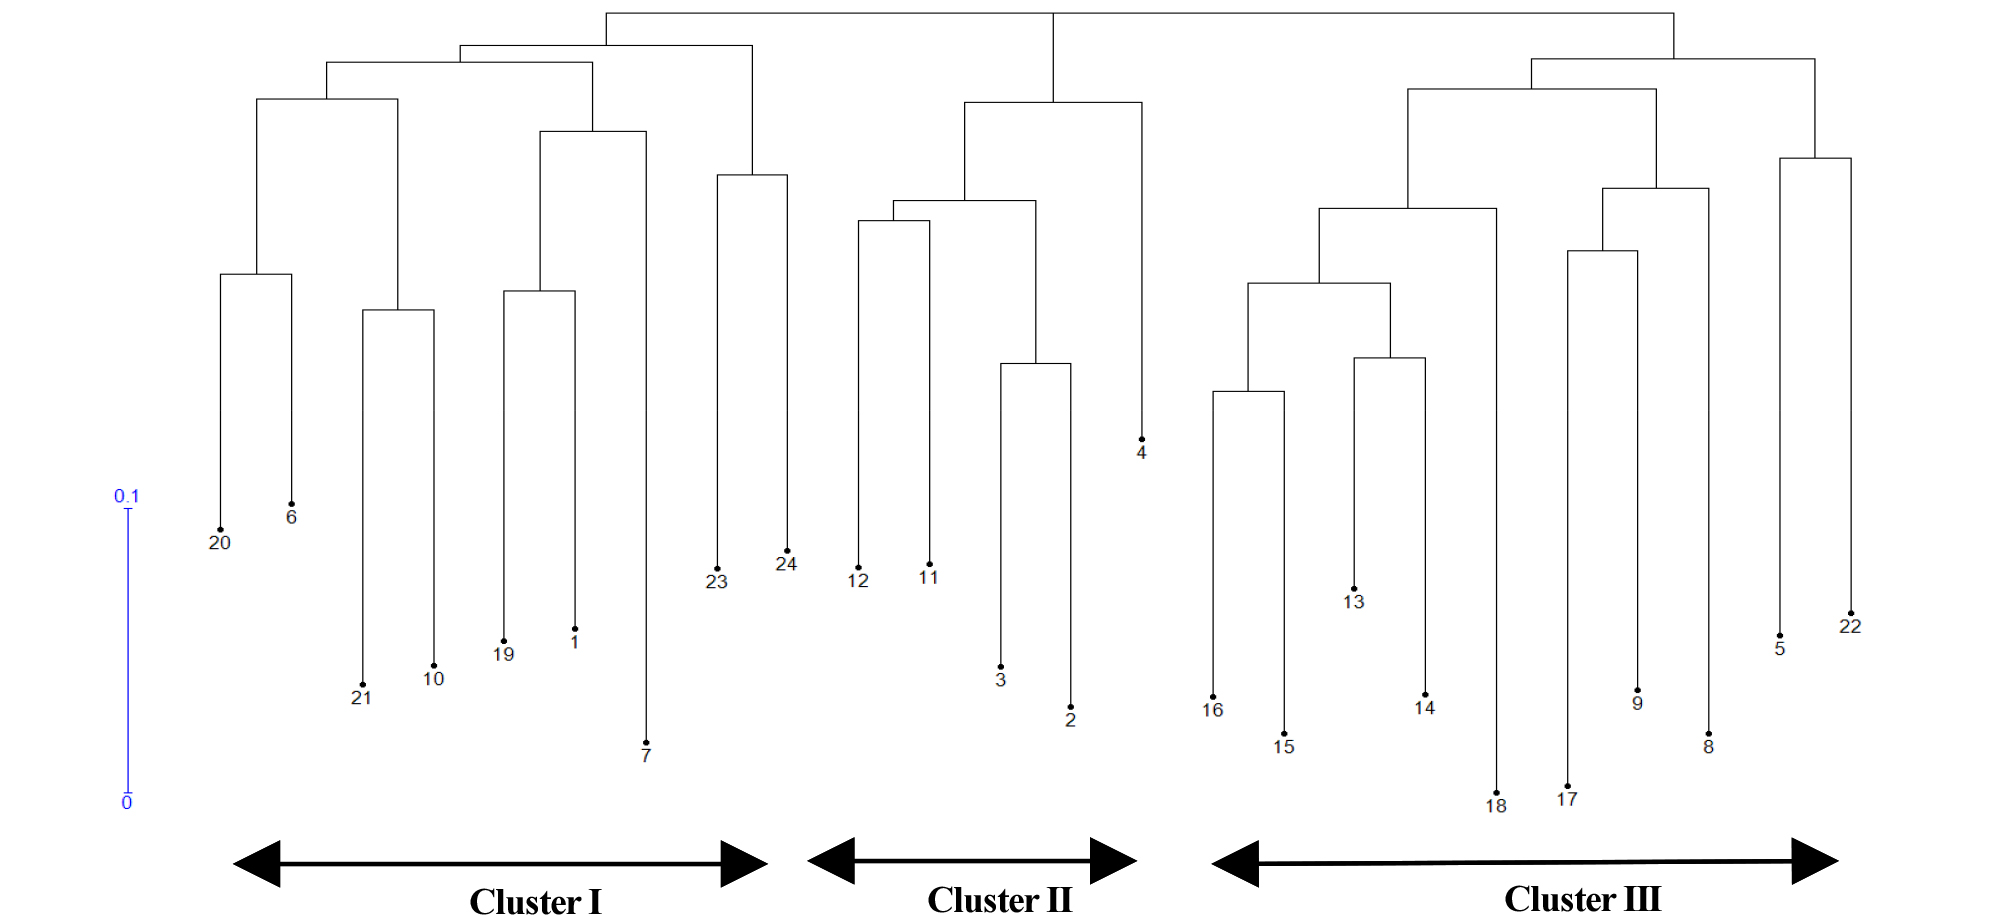
The unweighted neighbor-joining dendrogram was constructed based on Nei’s similarity coefficient of 24 genotypic data and showing the genetic relationship among the accession (Fig. 2). The 24 accessions were clustered into three distinct clusters (I, II and III). Cluster I was nine accessions such as two A- lines (females) and three B lines (maintainers) from Kenya, two landraces from USA, one Restorer and one variety. Cluster II contained five accessions, two R- lines from Kenya and three landraces from USA. Cluster III had ten accessions that consisted with seven accessions from Kenya and four from USA based on geographical collection region, but this cluster was mixed with their usage types such as landrace, maintainer, restore and female lines.
Population structure
STRUCTURE software (Pritchard et al., 2000) was used to determine the subdivisions of the accessions. The distribution of ΔK values was determined by evaluating logarithmic likelihood [L(K)] (Evano et al., 2005) and the LnP(D) values for different ΔKs ranged from 1 to 10. The structre harvester computed best value of K at 3. The genetic structure of 24 genetic accessions showed that the most probable number of subpopulation was three (Fig. 3) based on the ΔK values and the subgroups was in agreement the same accessions were placed under discrimination subgroups by unweighted neighbor-joining dendrogram except B1338 (number 22). B1338 was belonged to Cluster III by unweighted neighbor- joining, but it was located group 1 by STRUCTURE. The results of STRUCTURE analysis indicated that some of accession in Group 1 and 3 showed the admixture type, but group 2 was showed as pure lines. The admixtures observed by STRUCTURE analysis may be a result of cross-pollination in breeding process and have the same parental background.
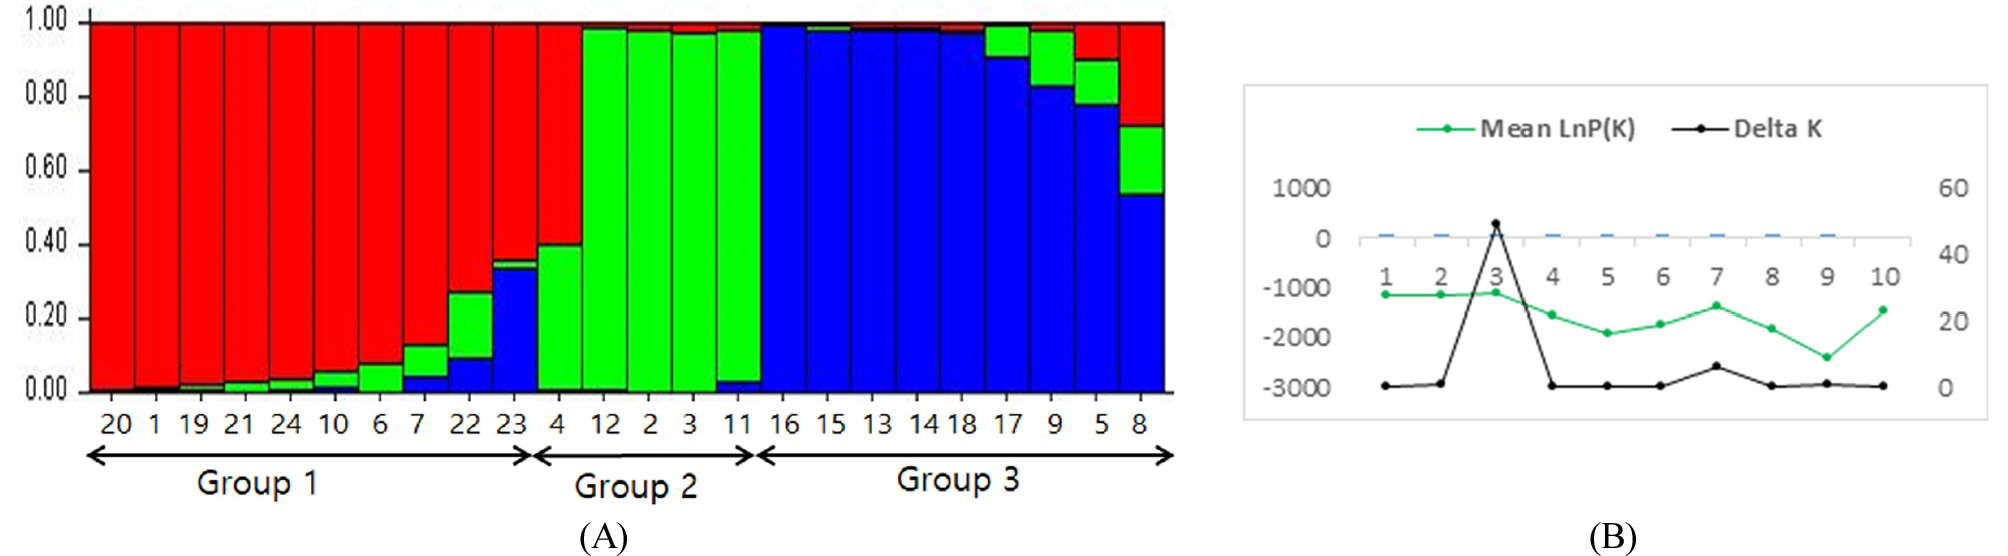
Fig. 3.
Population structure of 24 accessions of sunflower based on 34 SSR-markers. (A) Structure analysis (STRUCTURE K =3) distributed the population into groups according to the clusters obtained by the UNJ analysis. Numbers in the ‘y’ axis show the subgroup membership and the groups are represented by different colors. (B) Average log-likelihood values (mean lnP (D) for 3 iterations) and ad-hoc statistic ∆k for K values ranging from 1 to 10.
Principal coordinate analysis
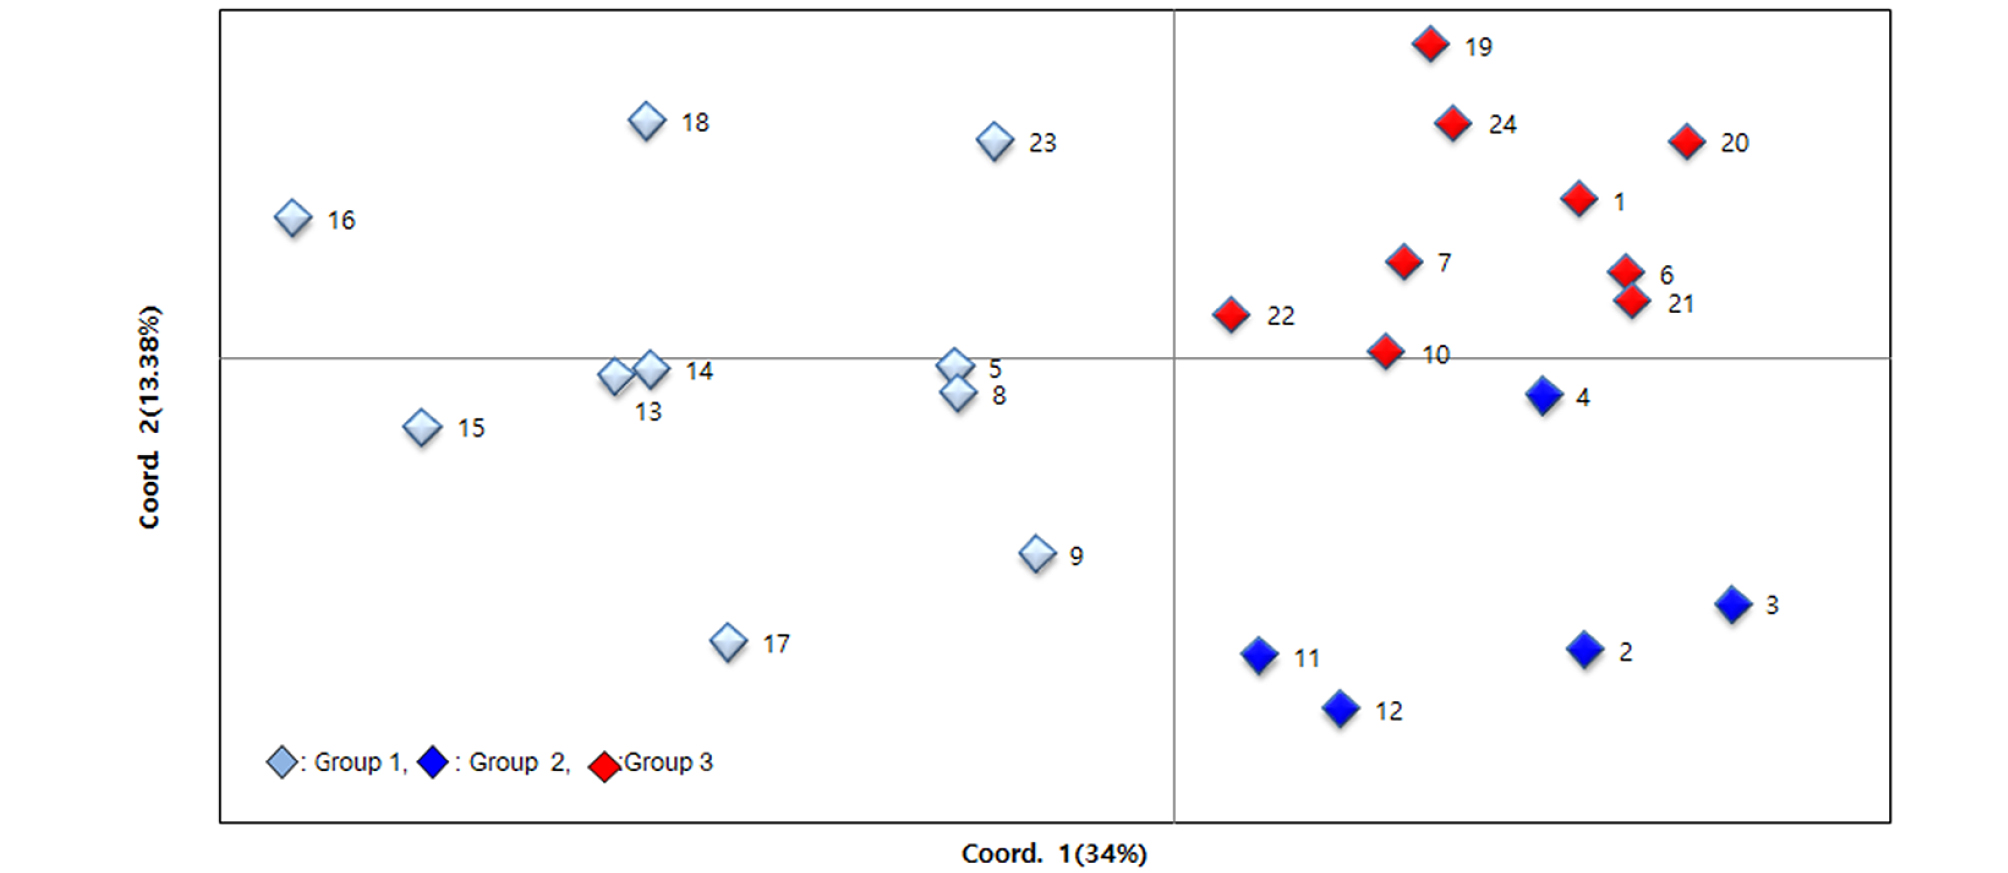
Principal coordinate analysis (PCoA) was conducted to further assess the population subdivisions identified using SRUCTURE. The principal coordinates explained 34% and 13.38% respectively, and 47.38% of total variation. The PCoA was largely consistent with results of STRUCTURE and the unweighted neighbor-joining dendrogram, the first principal coordinate (PCo1) clearly separated 24 sunflower genotypes into two population and one of group could divide into two subpopulations by the PCo2. All subpopulations were not consisted with collection sites of geographical regions, but the accessions belong to cluster I of UPGMA and group 1 of STRUCTURE showed the more diversity than the other subpopulations (Fig. 4).
Discussion
Estimate the genetic diversity of plant breeding resources is one of the important pre-breeding activities in crop breeding. The analysis of genetic diversity could be used for three reasons; one is to identify genotypes that underlie important phenotypic and genetic shifts during domestication and breeding using the approach of elimination method (Vigouroux et al., 2008). Second is to introduce aspects of the history and timing of domestication and the third is to identify distinct genetic group for retention of germplasm (Agrama and Eizenga, 2009). Identification of sunflower cultivars, lines and hybrids of Kenyan genetic resources have been based on morphological traits and morphological data cannot provide reliable information of calculation of genetic distance in term validation of pedigree (Stanton et al., 1994). In this study, 24 Kenyan sunflower accessions that were mainly used in inbreeding and hybrid breeding system in Kenya is to evaluate the genetic to constitutes backbone to improve the breeding program through the introduction of foreign genes.
In most cases population structure and genetic diversity are commonly estimated using SSR derived information. Genomic SSR are essential markers for population diversity because of their high level of polymorphism. Recently, the use of EST-SSRs with gSSR markers has been an increase to capture high level of reliable diversity. In this study EST-SSR and gSSR markers that were reported position of chromosome map by Heesacker et al. (2008) were used to analysis of diversity of sunflower gemplasm accessions. The rage of PIC value was from 0.141 to 0.788 and a mean He of 0.41. This was very important, because high PIC value indicates high polymorphism. Markers of a polymorphism higher than 0.5 are useful in genetic studies for they help in distinguishing polymorphism rates of a marker of a specific loci (DeWoody et al., 1994). Observed heterozygosity ranged from 0.00 to 0.083. This was very low as it is expected for inbred lines. Ho values were only recorded for HA292, HT410 and HA331 Expected heterozygosity values for the EST-SSR markers ranged from 0.156 to 0.830 (Table 2). There were differences in the number of alleles and the number of private alleles was detected among the subpopulations, but there were no detectable differences in terms of expected heterozygosity.
An UPGMA branch indicated the existence of 3 genetic groups in these set of germplasm, however few of the genotypes had no clear corresponding relationship between clustering groups as it was also observed by Ali et al. (2016) in their study of diversity in foxtail millet. Used sunflower accessions were not consisted with geographical collected region, but used accessions were divided into three subgroups according to their usage of F1 hybrid and inbreeding system STRUCTURE and PCoA. Several studies have been done to evaluate the levels and distribution of genetic diversity in different sunflower accessions, and reported that landraces of sunflower are divide into their collection area, but inbred lines and F1 hybrid materials were not classified by geographically (Mandel et al., 2011; Moreno et al., 2013). This reason is that cytoplasmic male sterility (CMS) has been used to hybrid breeding in sunflower and resources of CMS are very restricted.
B1326 has been used maintainer to A6213 of female line and the two accessions were located the same cluster, and these two lines are expected the best recombination to make the F1 hybrid. Because the maintainer lines have the restorer fertile and sterile on some female lines that have not fertility, which have involved the maintaining of some gene pools to maximize heterosis in hybrid crosses (Dimitrijevic and Horn, 2017; Fehr, 1991). Only one B line (B1340) was belong to cluster I that consisted with most of the R lines were clustered. It could be due to the breeding history and timing of the development of the two types. We conclude that the estimation of genetic diversity and population structure of 24 main breeding materials of Kenyan sunflower using SSR primer pairs may provide more accurate information to sunflower breeders than the classical pedigree method. The 34 SSR primer pairs used in this study may also be of potential value for further research on genetic mapping, segregation analysis and phylogenetic status of newly introduced germplasm.
