

Introduction
Materials and Methods
Plant materials and DNA extraction
GBS library preparation and sequencing
Single nucleotide polymorphisms (SNP) discovery and filtering
Assessment of genetic diversity
Inference of population structure and phylogenetic relationships
Estimation of genetic differentiation and historical gene flow
Results
Genome-wide SNP discovery
Intraspecific and interspecific genetic variation
Population structure and phylogenetic relationships
Genetic differentiation and gene flow
Discussion
Introduction
Lettuce (Lactuca sativa L.) is one of the most popular and economically significant leafy vegetables, with a global production of approximately 28.1 million tones in 2023 (FAOSTAT, 2023). It is a rich source of dietary fiber, vitamins, and various health-beneficial bioactive compounds such as polyphenols, carotenoids, and chlorophylls (Kim et al., 2016; Li et al., 2010; Yang et al., 2022). Lettuce is an annual or biennial herbaceous plant belonging to the genus Lactuca in the family Asteraceae. It is generally believed to have originated in Southwest Asia or the eastern Mediterranean region (de Vries, 1997; Pitrat, 2012; Whitaker, 1969). Earlier studies suggested that the high genetic diversity in cultivated lettuce may be attributed to its polyphyletic origin (Kesseli et al., 1991), with multiple wild species, including L. saligna L. and L. virosa L., potentially contributing to its domestication (Koopman et al., 1998; Zohary, 1991). However, recent genome-wide analyses support a predominantly monophyletic origin, indicating that cultivated lettuce was domesticated from a single wild ancestor, L. serriola L.. (Wei et al., 2021; Zhang et al., 2017). Although the monophyletic origin of cultivated lettuce from L. serriola is now widely accepted, the roles of other wild species in its domestication remain unclear, warranting further investigation into their genetic relationships.
Wild relatives of crops are often classified according to the gene pool concept, which is based on the degree of cross- compatibility with the cultivated species (Harlan and de Wet, 1971). The genus Lactuca comprises approximately 150 species, of which about 20 are classified into three gene pools relevant to lettuce (van Treuren et al., 2012). The primary gene pool includes L. sativa and its most compatible wild relative L. serriola, along with six other fully inter-fertile wild species. The secondary gene pool is represented solely by L. saligna, while the tertiary gene pool, which requires advanced techniques for hybridization, consists of L. virosa and approximately ten additional species. Among these, L. serriola, L. saligna, and L. virosa are main wild species most extensively utilized in lettuce breeding programs (Lebeda et al., 2014). Although L. indica L. is not included in the classic lettuce gene pool framework, it is frequently incorporated in phylogenetic and genetic diversity studies of lettuce due to its taxonomic position, which allows it to serve as a useful reference species representing an outgroup or a divergent lineage (Chu et al., 2022; van Treuren et al., 2018).
The advancement of next-generation sequencing (NGS) technologies have facilitated the study of domestication processes and phylogenetic relationships between cultivated species and their wild relatives across a wide range of crop species, such as rice (McNally et al., 2009), maize (Hufford et al., 2012), soybean (Lam et al., 2010), pepper (Liu et al., 2023), and spinach (Cai et al., 2021). In the case of lettuce, although studies have been conducted at multiple molecular levels—including the genome, transcriptome, metabolome, and methylome (Cao et al., 2024; van Treuren et al., 2018; Wei et al., 2021; Zhang et al., 2017)—further research is needed to fully elucidate its complex domestication history and the genetic contributions of multiple wild relatives.
Investigating genetic diversity and population structure constitutes a critical foundation for elucidating phylogenetic relationships among species (Esther et al., 2019). In this study, we analyzed 145 accessions representing five Lactuca species using genotyping-by-sequencing (GBS) to explore the phylogenetic relationships between cultivated lettuce and its wild relatives. Genetic diversity among the Lactuca species was assessed, and phylogenetic relationships were inferred through population structure analysis and maximum likelihood phylogenetic tree construction. In addition, patterns of gene flow among species were investigated. These results provide valuable insights for future lettuce breeding strategies and the conservation of genetic resources.
Materials and Methods
Plant materials and DNA extraction
A total of 145 accessions representing five Lactuca species—19 L. indica, 27 L. saligna, 77 L. sativa, 10 L. serriola, and 12 L. virosa—were obtained from the National Agrobiodiversity Center (http://genebank.rda.go.kr) and analyzed. L. serriola (syn. L. scariola L.) is designated as an invasive species in South Korea. Prior to the experiment, permission for its cultivation, transportation, and conservation was obtained from the Jeonbuk Regional Environmental Office (Permission No. EJ202405DIP0001). Detailed information, including sample ID, species, origin, and accession type, is provided in Supplementary Table S1. One seedling per accession was sampled 40 days after sowing, at the 5–6 leaf stage. Genomic DNA was extracted from lyophilized seedling tissue using the Genomic DNA Prep Kit (Inclone Biotech, Seongnam, Korea) following the manufacturer's protocol.
GBS library preparation and sequencing
For each accession, two GBS libraries were constructed: one using the ApeKI restriction enzyme and the other using a combination of PstI and MspI (Poland et al., 2012). Libraries were prepared following previously established protocol with minor modifications (Elshire et al., 2011). The Illumina DNA Prep Kit (Illumina Inc., San Diego, CA, USA) was used for library preparation. Library quality and fragment size distribution were evaluated using a Bioanalyzer and High Sensitivity DNA Chip (Agilent Technologies, Santa Clara, CA, USA). Sequencing was performed on the Illumina NovaSeq 6000 platform, yielding approximately 100 Gb of short-read data.
Single nucleotide polymorphisms (SNP) discovery and filtering
Raw sequencing reads were demultiplexed using the “pro cess_ hortread” function in Stacks v2.61 (Catchen et al., 2013). Adapter sequences and low-quality reads were trimmed using Cutadapt v4.4 (Martin, 2011) and Trimmomatic v0.39 (Bolger et al., 2014). High-quality reads were aligned to the L. sativa reference genome (Reyes-Chin-Wo et al., 2017) using BWA- MEM v0.7.17 (Li and Durbin, 2009). A summary of the sequencing output is presented in Supplementary Table S2. SNP and indel variants were identified using GATK HaplotypeCaller v4.2 (De Summa et al., 2017), and filtered with VCFtools v0.1.16 (Danecek et al., 2011). Filtering criteria included: biallelic SNPs only, minor allele frequency ≥ 0.05, minimum read depth > 5, genotype quality > 20, and missing data rate < 30%. The number of filtered SNPs and heterozygous genotype ratios by chromosome are presented in Supplementary Table S3.
Assessment of genetic diversity
To evaluate genetic diversity among Lactuca species, the following metrics were calculated using GenAlEx v6.51b2 (Peakall and Smouse, 2012): mean number of alleles (Na), effective number of alleles (Ne), observed heterozygosity (Ho), expected heterozygosity (He), unbiased expected heterozygosity (uHe), Shannon’s information index (I), and fixation index (F). Analysis of molecular variance (AMOVA) was conducted to partition variation within and among species based on PhiPT.
Inference of population structure and phylogenetic relationships
Principal component analysis (PCA) was performed using R v4.4.1 (R core team, 2025) to visualize genetic relationships and overall population structure for 145 Lactuca accessions. Population structure was further inferred using STRUCTURE v2.3.4 (Pritchard et al., 2000), with K values ranging from 1 to 10, each with 10 replicates. Each run comprised a burn-in of 10,000 iterations followed by 10,000 Markov Chain Monte Carlo (MCMC) iterations under the admixture model. The optimal K and clustering patterns were determined using the ΔK method (Evanno et al., 2005) implemented in Structure-Selector (Li and Liu, 2018). Individuals with a membership coefficient (q) ≥ 0.7 were assigned to a specific cluster, while those with q < 0.7 were considered genetically admixed. STRUCTURE PLOT v2.0 (Ramasamy et al., 2014) was used to visualize admixture proportions.
Phylogenetic relationships among species were inferred using a maximum likelihood (ML) tree constructed in IQ- TREE 2 (Minh et al., 2020), under the GTR+ASC model with 1,000 bootstrap replicates. The resulting tree was visualized and annotated using iTOL v7.2 (Minh et al., 2020).
Estimation of genetic differentiation and historical gene flow
Genetic differentiation among species was assessed using both PhiPT (AMOVA-based) and Fst (allele frequency-based) values. Nei’s genetic distance was also calculated and compared with PhiPT values. To estimate gene flow, Fst values were used to calculate Nm (effective number of migrants). In addition, historical gene flow patterns were inferred using TreeMix v1.12 (Pickrell and Pritchard, 2012).
Results
Genome-wide SNP discovery
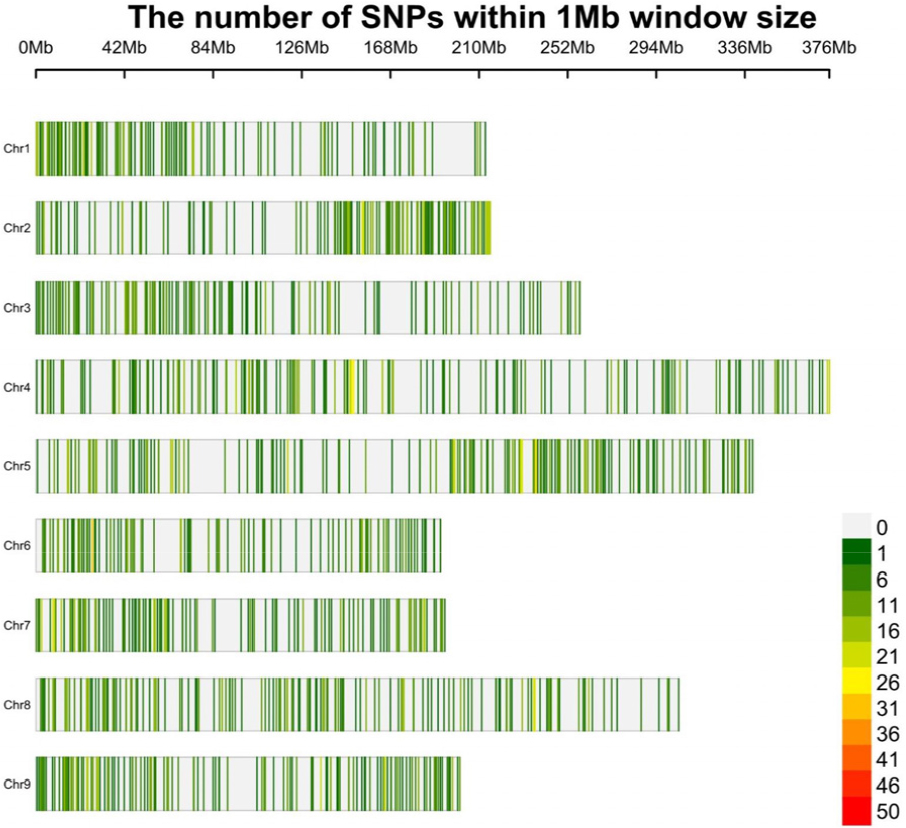
A total of 5,301 high-quality SNPs were obtained from GBS data by mapping reads to the published L. sativa reference genome downloaded from the Phytozome of UC Davis Lettuce Genome Resource. The number of SNPs varied across chromosomes, ranging from 432 on chromosome 6 to 792 on chromosome 5 (Supplementary Table S3), with an overall even distribution across all nine chromosomes (Fig. 1).
Intraspecific and interspecific genetic variation
To assess genetic variation within and among species, several diversity indices were calculated for each of the five Lactuca species. Among them, L. virosa exhibited the highest genetic diversity, as indicated by its greatest effective number of alleles (Ne = 1.30), unbiased expected heterozygosity (uHe = 0.20), and Shannon's information index (I = 0.29) followed by L. saligna and L. indica (Table 1).
Table 1.
Summary of genetic diversity parameters for each Lactuca species.
| Species | Nz | Nay | Nex | How | Hev | uHeu | It | Fs |
| L. indica | 9.72 | 1.50 | 1.17 | 0.10 | 0.14 | 0.16 | 0.23 | 0.17 |
| L. saligna | 21.89 | 1.69 | 1.25 | 0.16 | 0.16 | 0.17 | 0.26 | 0.00 |
| L. sativa | 71.47 | 1.83 | 1.17 | 0.11 | 0.12 | 0.12 | 0.21 | 0.07 |
| L. serriola | 9.09 | 1.27 | 1.11 | 0.07 | 0.07 | 0.07 | 0.11 | -0.02 |
| L. virosa | 11.01 | 1.60 | 1.30 | 0.21 | 0.19 | 0.20 | 0.29 | -0.09 |
| Mean | 24.64 | 1.58 | 1.20 | 0.13 | 0.14 | 0.14 | 0.22 | 0.03 |
Analysis of molecular variance (AMOVA) revealed that 54% of the total genetic variation was attributable to differences among species, while 46% resided within species (Table 2). A high level of genetic differentiation was observed among the five species (PhiPT = 0.54, p &01), accompanied by very limited interspecific gene flow (Nm = 0.21).
Table 2.
Analysis of molecular variance (AMOVA), genetic differentiation (PhiPT), and gene flow (Nm) among 145 Lactuca accessions.
| Source | dfz | SSy | MSx | Est. Var.w | %v | PhiPTu | Nm |
| Among Species | 4 | 255644.27 | 63911.07 | 2600.94 | 54% | 0.54 * | 0.21 |
| Within Species | 140 | 307576.65 | 2196.98 | 2196.98 | 46% | ||
| Total | 144 | 563220.92 | 4797.92 | 100% |
Population structure and phylogenetic relationships
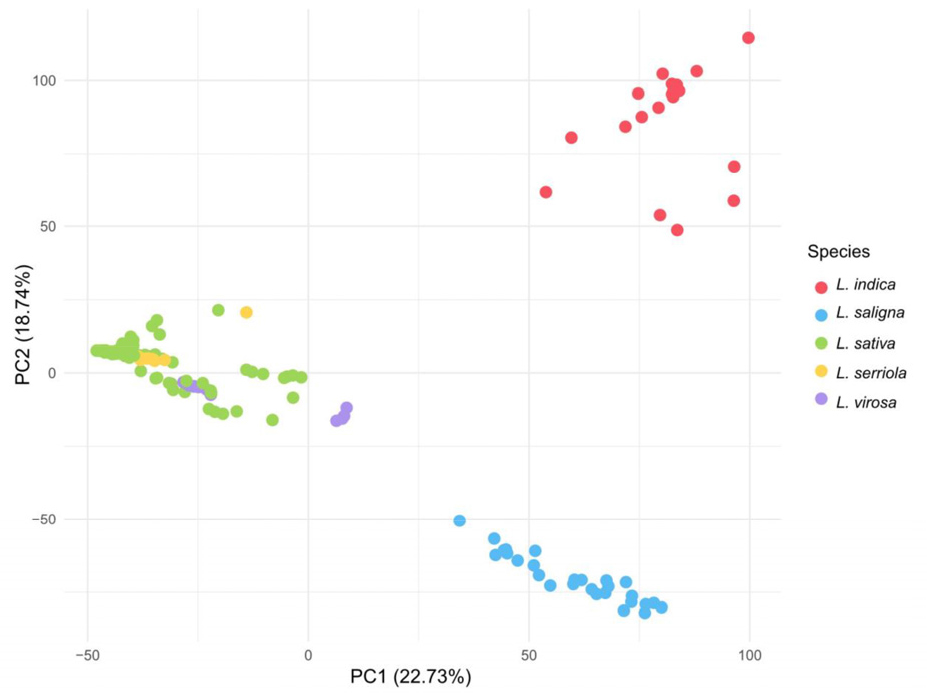
We next examined how this variation is reflected in population structure and phylogenetic relationships. The PCA was conducted to assess genetic relatedness and overall structure among accessions. The first two principal components (PC1 and PC2) accounted for 22.73% and 18.74% of the total variation, respectively, explaining a combined 41.47% of the genetic variation. L. indica and L. saligna each formed well- separated clusters along the PC1 axis, clearly distinguished from the other species. In contrast, L. sativa, L. serriola, and L. virosa exhibited overlapping distributions, with no clear species-level separation observed among them (Fig. 2).
Although STRUCTURE analysis revealed the highest ΔK was observed at K = 4, a secondary peak at K=2 also indicated a biologically meaningful subdivision (Fig. 3A, Fig. 3B). At K = 2, PopA was composed primarily of L. indica and L. saligna accessions, most of which were classified as wild species types. PopB included the majority of L. sativa accessions, which were predominantly cultivars. At K = 4, L. indica and L. saligna each formed distinct clusters corresponding to Pop1 and Pop2, respectively. Pop3 contained most L. sativa accessions, all L. serriola, and two L. virosa accessions, and was largely composed of cultivars. Pop4 also consisted mainly of L. sativa, but was enriched for accessions classified as wild types or landraces. In both the K = 2 and K = 4, the majority of admixed individuals were identified as L. sativa (Fig. 3C).
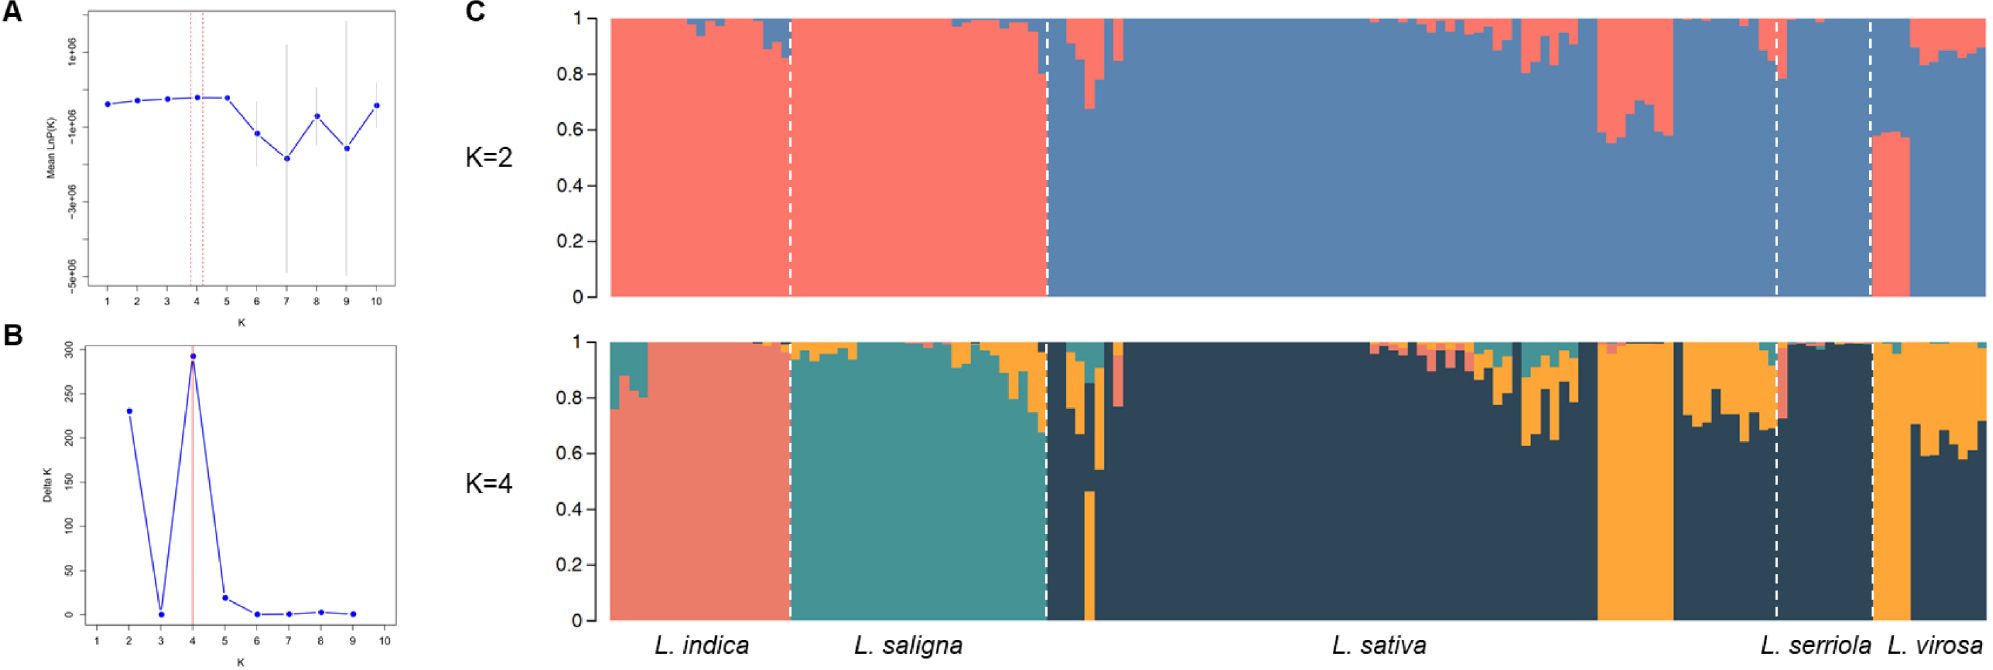
Fig. 3.
Population structure of 145 Lactuca accessions. (A) Mean log-likelihood [LnP(K)] values for K = 1 to 10. (B) Delta K values across different numbers of clusters. (C) Estimated genetic structure of the accessions at K = 2 and K = 4. Each color represents a distinct genetic cluster. Accessions were grouped by species, separated by white vertical lines.
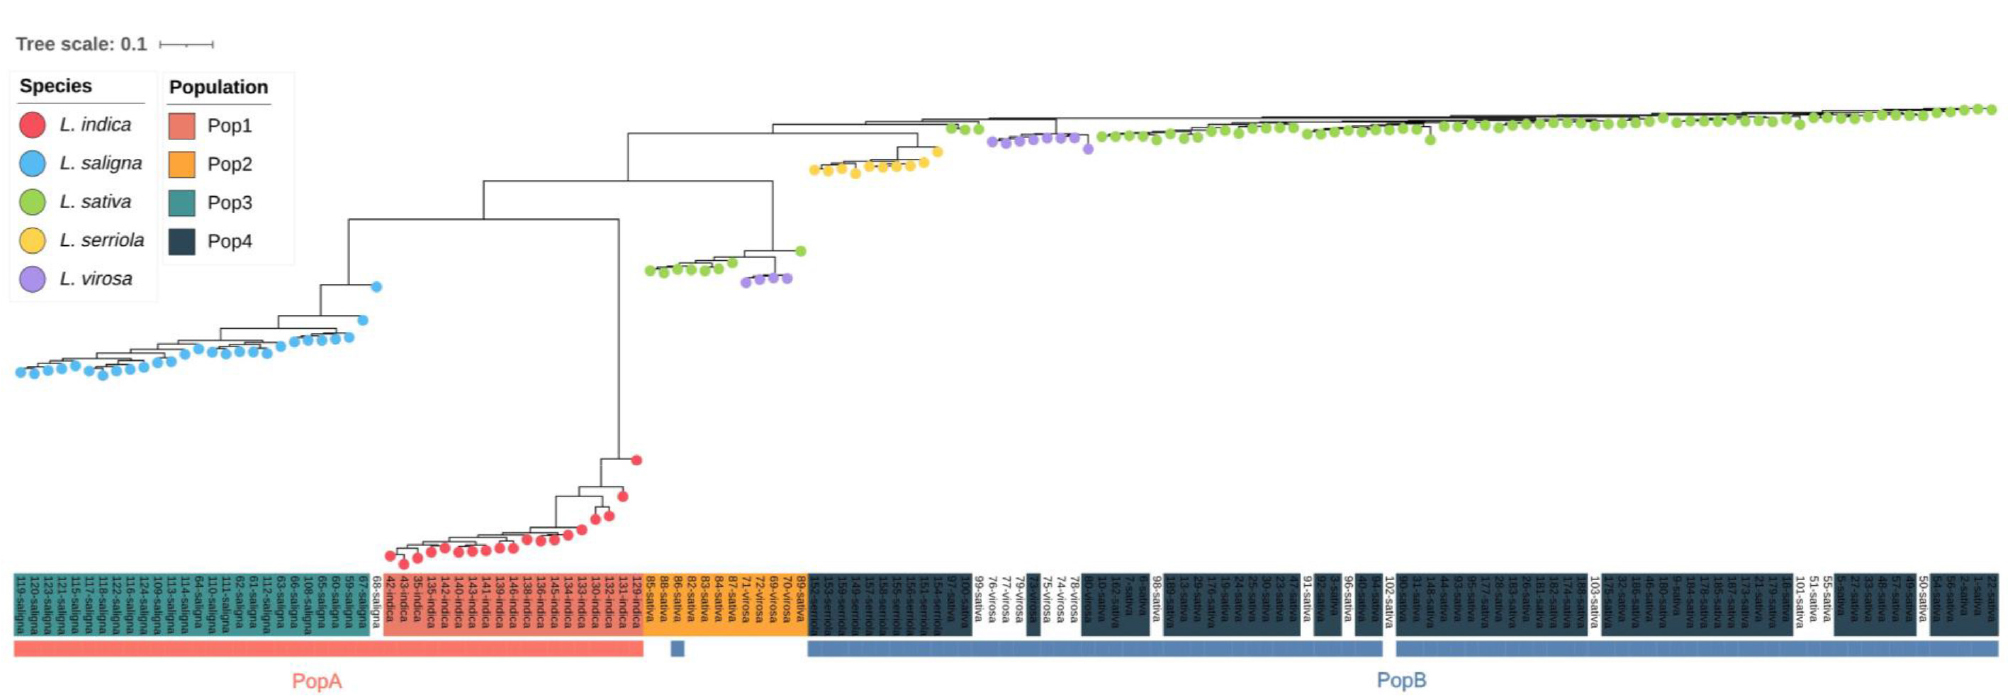
The ML tree largely reflected species-level clustering and was broadly consistent with the genetic structure inferred from the STRUCTURE analysis. L. indica and L. saligna each formed clades that were clearly separated from the other taxa, whereas L. sativa, L. serriola, and L. virosa were positioned more closely together. Accessions of L. sativa and L. virosa were divided into two subgroups. One subgroup, corresponding to PopB, included most L. sativa accessions along with admixed L. virosa. The other subgroup consisted of accessions identified as admixed at K = 2 and grouped into Pop4 under the K = 4. L. serriola formed a central clade between these two subgroups and appeared more closely related to the PopB lineage (Fig. 4).
Genetic differentiation and gene flow
To further assess genetic differentiation among Lactuca species, pairwise values of PhiPT, Nei’s genetic distance, Fst, and gene flow (Nm) were calculated. PhiPT and Nei’s genetic distances are presented in Table 3, while Fst and corresponding estimates of gene flow (Nm) are shown in Table 4. These results were largely consistent with the phylogenetic relationships observed in the ML tree. L. indica and L. saligna exhibited the greatest genetic differentiation and distance in all pairwise comparisons, along with the lowest levels of gene flow. In contrast, L. sativa, L. serriola, and L. virosa showed relatively low levels of differentiation and higher levels of gene flow among one another. Notably, L. serriola and L. virosa were genetically the closest to L. sativa (Nei’s distance = 0.05), whereas L. virosa showed the lowest Fst (0.15) and the highest gene flow estimate (Nm = 1.37) with L. sativa.
Table 3.
Pairwise genetic differentiation and genetic distance among Lactuca species.
| Species | L. indica | L. saligna | L. sativa | L. serriola | L. virosa |
| L. indica | - | 0.57z | 0.69 | 0.63 | 0.61 |
| L. saligna | 0.51y | - | 0.53 | 0.51 | 0.42 |
| L. sativa | 0.47 | 0.27 | - | 0.23 | 0.20 |
| L. serriola | 0.50 | 0.31 | 0.05 | - | 0.32 |
| L. virosa | 0.46 | 0.22 | 0.05 | 0.10 | - |
Table 4.
Pairwise genetic differentiation and gene flow among Lactuca species.
| Species | L. indica | L. saligna | L. sativa | L. serriola | L. virosa |
| L. indica | - | 0.53z | 0.65 | 0.61 | 0.56 |
| L. saligna | 0.22y | - | 0.46 | 0.45 | 0.35 |
| L. sativa | 0.14 | 0.29 | - | 0.19 | 0.15 |
| L. serriola | 0.16 | 0.30 | 1.05 | - | 0.25 |
| L. virosa | 0.20 | 0.46 | 1.37 | 0.74 | - |
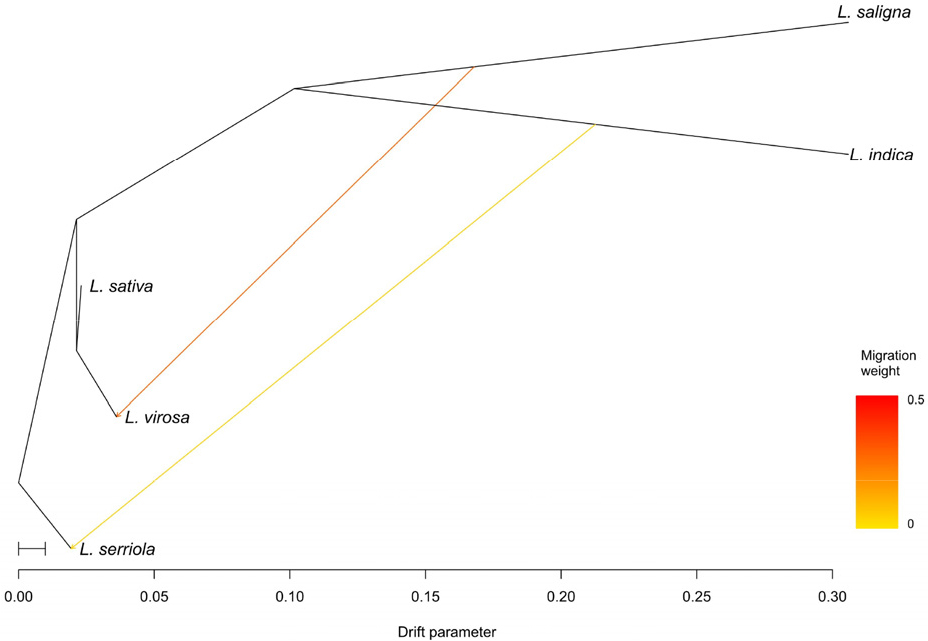
To infer the historical direction of gene flow among Lactuca species, optimal number of migration edges (m) was determined to be two (Supplementary Fig. S1). The TreeMix analysis inferred two historical migration events: one from L. saligna to L. virosa with a migration weight of 0.29, and another from L. indica to L. serriola with a weight of 0.05 (Fig. 5). These results suggested moderate gene flow from L. saligna to L. virosa, whereas the signal of gene flow from L. indica to L. serriola was relatively weak.
Discussion
This study analyzed 5,301 high-quality SNPs across 145 accessions representing five Lactuca species, providing insights into genetic diversity, population structure, and phylogenetic relationships among wild and cultivated lettuce. The results refine our understanding of Lactuca domestication and the genetic contributions of its wild relatives.
Wild relatives generally harbored higher levels of genetic diversity than the domesticated species, which often undergo severe genetic bottlenecks during domestication (Purugganan and Fuller, 2009; Tanksley and McCouch, 1997). This pattern has also been observed in other crops, such as cucumber, rice, and tomato (Huang et al., 2012; Lin et al., 2014; Qi et al., 2013), and was largely consistent with our findings: all wild relatives—except L. serriola—exhibited greater genetic diversity than L. sativa. The relatively low diversity observed in L. serriola may be attributed to its demographic history in South Korea. All accessions used in this study were collected from naturalized populations that were accidentally introduced in the late 1970s and have since spread rapidly (Kim et al., 2013; Lee et al., 2022). The species has been designated as invasive in South Korea (Ryu et al., 2017). This recent introduction and subsequent rapid expansion suggest that these populations likely originated from a limited number of founder individuals, which may have caused a founder effect and contributed to the reduced genetic diversity observed in this population. Expanding future studies to include L. serriola accessions from its broader native range, such as Europe and the Middle East, may provide a more comprehensive understanding of its genetic diversity and its relationship to cultivated lettuce.
AMOVA revealed that 54% of total genetic variation resided among species, suggesting pronounced interspecific divergence. This was further supported by a high PhiPT value (0.54, p &01) and low gene flow estimates (Nm = 0.21). Given that Nm < 1 is generally insufficient to counteract genetic drift (Slatkin, 1987), these results indicate long- standing reproductive isolation and the accumulation of species-specific genetic variation.
Population structure and phylogenetic analyses consistently supported a close relationship between L. sativa and L. serriola, reinforcing the hypothesis that cultivated lettuce was domesticated from L. serriola (Hill et al., 1996; Hu et al., 2005; Rauscher and Simko, 2013). Most L. sativa accessions shared ancestry components with L. serriola, and both formed closely related clusters in the ML tree. These patterns provide supportive evidence for a monophyletic origin of L. sativa. Nonetheless, several L. sativa accessions exhibited ancestry components similar to those predominant in L. virosa. Additionally, the pairwise genetic distance between L. sativa and L. virosa was identical to that between L. sativa and L. serriola. These findings suggest either historical introgression or the retention of ancestral polymorphisms, both can generate genetic variation shared between closely related species (Zhou et al., 2017).
The geographic origins of admixed accessions further contextualize these findings. Notably, most admixed accessions involving L. sativa and L. virosa were collected from Europe—a region that is both a major center of L. sativa breeding and a native range of Lactuca wild relatives, including L. virosa (Lebeda et al., 2004). Previous reports have documented the introgression of L. virosa into crisphead lettuce cultivars, especially in North America (Mikel, 2007). Our findings therefore support the possibility of intentional or historical introgression from L. virosa into cultivated lettuce. Clarifying the extent of this contribution will require additional analyses integrating genome-wide data with cultivar lineages and phenotypic traits. In contrast, L. indica and L. saligna formed clearly distinct clusters with minimal evidence of admixture, suggesting limited contribution to the L. sativa gene pool.
Despite the strong overall interspecific differentiation observed among Lactuca species, pairwise comparisons revealed relatively low differentiation and high gene flow among L. sativa, L. serriola, and L. virosa. This suggests uneven patterns of gene flow among species. Notably, estimated gene flow between L. sativa and L. virosa (Nm = 1.37) was higher than between L. sativa and L. serriola (Nm = 1.05), even though the latter is considered the genetically closest relative of L. sativa. This result appears inconsistent with previous studies based on nuclear genomic data, which have generally shown L. virosa to be more genetically distant from L. sativa (Wei et al., 2021; Zhang et al., 2017). Interestingly, a closer relationship between these two species has been reported in analyses of mitochondrial genomes (Fertet et al., 2021). This apparent discrepancy may reflect differences in data type, SNP selection strategies, or lineage representation across studies. Further, as previously noted, the L. serriola accessions in our study were limited to low-diversity populations naturalized in South Korea. This may have contributed to an underestimation of its genetic proximity to L. sativa, making L. virosa appear comparatively closer in our analyses. Taken together, our results suggest that the relationship between L. sativa and L. virosa may be more complex than previously recognized, with their apparent genetic connectivity influenced by sampling composition and marker characteristics.
To further investigate potential gene exchange among species, we used TreeMix to infer historical migration events. The model detected two directional gene flow events: from L. saligna to L. virosa (migration weight = 0.29), and from L. indica to L. serriola (weight = 0.05). The species pair L. saligna and L. virosa differ substantially in karyotype and rDNA organization, which results in reproductive incompatibility (de Vries, 1990; Matoba et al., 2007). Although direct assessments of cross compatibility between L. indica and L. serriola have not been reported, the pronounced genetic divergence of L. indica from other Lactuca species suggests potential barriers to hybridization (Mizutani and Tanaka, 2003). Taken together, these signals may reflect older introgression events or incomplete lineage sorting.
In conclusion, our results confirm the primary genetic affinity between L. sativa and L. serriola, supporting the hypothesis of a monophyletic domestication origin. However, admixture signals with L. virosa suggest that it may have contributed alleles to cultivated lettuce via historical introgression or ancestral polymorphism. These findings expand our understanding of lettuce evolution and highlight the complex genetic relationships between cultivated lettuce and its wild relatives. Further, recent evaluations have underscored the importance of conserving diverse plant genetic resources (Yu et al., 2025). The results offer a valuable genomic framework for future efforts in germplasm conservation and crop improvement.
