

Introduction
Materials and Method
Seed collection and field cultivation
Data recording and classification
Data analysis
Results and Discussion
Variations of qualitative agronomic traits
Variations of quantitative agronomic traits
Effect of origin on qualitative and quantitative agronomical traits
Multivariate analysis
Introduction
Mung beans (Vigna radiate (L.) R. Wilczek), belonging to the legume (Fabaceae) family, are known for their nutritional profile and wide-ranging health benefits. They are rich in protein, polysaccharides, fibers, and several vitamins including vitamin B6, folate, and vitamin C, as well as minerals such as magnesium, potassium, and iron (Ganesan and Xu, 2018; Hou et al., 2019; Qin et al., 2022; Wang et al., 2021). Mung beans also possess a high concentration of antioxidants such as phenolic acids, flavonoids, anthocyanins, and tannins that can combat oxidative stress and reduce the development of chronic ailments including heart disease and cancer (Li et al., 2012; Sehrawat et al., 2023; Singh et al., 2017). Because of their low glycemic index, mung beans are also renowned for their ability to regulate blood sugar levels making them advantageous for individuals with diabetes (Hou et al., 2019). Being in the legume family, mung beans are also known for their ability to fix nitrogen in the soil by forming a symbiotic partnership with rhizobia bacteria. This helps to enrich the soil with an essential nutrient, making them valuable in crop rotation to improve soil fertility (Meena et al., 2021; Thomas et al., 2004).
Similar to other crops, including legumes, mung bean breeding has experienced advancement in recent years (Nair et al., 2019). More importantly, the recent genome sequence has led to a research emphasis on developing improved mung bean varieties that have superior characteristics in terms of disease resistance, yield, nutritional profiles, and adaptability to unfavorable environmental conditions such as drought, salinity, and high temperature (Ha et al., 2021; Kang et al., 2014; Van Haeften et al., 2023). These advances in breeding programs incorporate the utilization of several cutting-edge techniques such as molecular markers and genomic selection, which greatly benefit from mung bean genetic resources (Gwag et al., 2010; Kang et al., 2014; Van Haeften et al., 2023).
Mung bean germplasm collections possess a diverse range of genotypic and phenotypic traits that offer important qualities that could be utilized in breeding programs (Burlyaeva et al., 2019; Gayacharan et al., 2020; Schafleitner et al., 2015; Yimram et al., 2009). By utilizing and accessing these genetic resources, breeders can introduce desirable traits into new varieties to enhance the overall quality of mung beans (Chauhan and Williams, 2008; Singh et al., 2021; Yu et al., 2023). In general, extensive characterization of the agronomical characteristics of mung bean genetic materials is essential for the success of breeding programs (Chen et al., 2015; Van Haeften et al., 2023). Ultimately, these allow for the customization of mung bean varieties to meet the diverse needs of farmers, consumers, and food industries thus promoting food security and improving agricultural sustainability (Jeong et al., 2016; Sehrawat et al., 2023; Van Haeften et al., 2023). Moreover, it is important to note that various environmental and genetic factors influence the agricultural characteristics of plants, in general. Consequently, studying the influence of these factors in a large collection of plant genetic resources not only allows for a deeper understanding of their impact but also aids in the identification and selection of plant varieties possessing favorable traits (Dong et al., 2019; Nair et al., 2019; Oh et al., 2024; Vir et al., 2016; Yu et al., 2023).
Previously, several researchers analyzed the possible genetic diversity within mung bean genetic resources using ranges of phenotypic and genotypic traits (Burlyaeva et al., 2019; Chiteri et al., 2022, Gayacharan et al., 2020; Ghafoor et al., 2002; Mwangi et al., 2021; Sandhu and Singh, 2020; Schafleitner et al., 2015; Wang et al., 2018). Compared to other crops, studies on the genetic variation of legumes, in general, cultivated in Korea are limited. (Kim et al., 2018a). The gene bank at the National Agrobiodiversity Center (Jeonju, Republic of Korea) possesses a large collection of mung bean genetic materials. Research on these genetic materials aims at the identification of superior genotypes, their conservation for future use, and dissemination to farmers and other stakeholders. In this study, a total of 323 mung bean genetic materials originating from China, Korea, and India were recently cultivated along with six control cultivars. Then, their diversity was characterized using a total of twenty-two key agronomical traits. Moreover, the effect of origin on each of the agronomical traits was analyzed. To the best of our knowledge, this study is the first to extensively explore the diversity of mung bean genotypes originating from different countries and grown in Korea. The findings of this study could provide another deeper insight regarding the genetic diversity present in mung bean genetic resources and serve as a background for future genomic investigations.
Materials and Method
Seed collection and field cultivation
The mung bean seeds utilized in this study were collected from the gene bank at the National Agrobiodiversity Center, Rural Development Administration (RDA, Jeonju, Republic of Korea). Cultivation of the accessions was conducted in an experimental field found at the National Agrobiodiversity Center (Jeonju, latitude/longitude: 30°49'38.37'' N/127°09'7.78'' E). For each accession, 30 seeds were sown on June 21, 2022, in rows and half thinned after two weeks leaving only healthy individuals. The row plots were 15 ㎝ apart with a height of 20 ㎝ and a seed-to-seed spacing of 90 ㎝. The growing season lasted until October of the same year and matured seeds were hand harvested. The average temperature and precipitation during the cultivation year were 23.7°C and 164.2 ㎜ in June, 27.0°C and 184.0 ㎜ in July, 26.3°C and 311.3 ㎜ in August, 22.6°C and 64.5 ㎜ in September, and 15.2°C and 51.1 ㎜ in October. The average humidity was 73.0% in June, 78.0% in July, 79.0% in August, 70.0% in September, and 67.0% in October.
Data recording and classification
A total of 22 agro-morphological traits, including thirteen qualitative (including hypocotyl color, growth type, growth habit, pubescence density of pod, terminal leaflet shape, petiole color, flower color, pod color, pod curvature, seed shape, seed color, seed dot, and seed coat surface luster) and nine quantitative (including the rate of germination (GR), days to flowering (DF), days to maturity (DM), days from flowering to maturity (DFM), plant height (PH), lodging rate (LR), number of pods per plant (PPP), number of seeds per pod (SPP), and one-hundred seeds weight (HSW)) traits, were recorded for each of the mung bean accessions. Data recording was made from field inspection during the growth period and from laboratory examination after harvesting. The phenotypic data was recorded following the manual developed by RDA (RDA, 2006) and recorded using the characterization record sheet designed by the World Vegetable Center (AVRDC-GRSU, 2008). Details regarding the determination of qualitative traits and measurements of quantitative traits are provided in Appendix 1 and Appendix 2 (Supplementary material). The mung bean accessions were then classified based on their origin. Accordingly, 98 accessions were from China, 125 accessions were from Korea, and the remaining 100 were from India (Appendix 3).
Data analysis
The diversity analysis for qualitative traits was calculated by applying the standardized Shannon-Weaver Diversity index (H'). The H' value was calculated using the formula below.
where pi is the frequency proportion (relative frequency) of ith descriptor state, and N is the total number of states observed within a trait (Rabara et al., 2014; Shannon, 1948). Likewise, the level of diversity in quantitative traits among the mung bean accessions was evaluated using the coefficient of variation (CV). The values of all the quantitative agronomical traits of each accession, except for DF, DM, and DFM, were reported as means. The difference between the mean values was examined using analysis of variance (ANOVA) and Duncan's multiple range test at a significance level of p < 0.05. This statistical analysis was conducted using xlstat software (Lumivero, CO, USA). Principal component analysis was also performed using the xlstat software, whereas Pearson's correlation matrix analysis and boxplots were carried out using R-software version 4.2 (www.r-project.org). Additionally, hierarchical cluster analysis was generated using JMP Pro-17 software (SAS, Inc., Cary, North Carolina, USA).
Results and Discussion
Variations of qualitative agronomic traits
The characterization and identification of plant genetic resources, in general, using qualitative agronomical traits is an important part of selecting the best genotypes for breeding. In addition, these traits impact the decisions made by farmers and consumers, ultimately affecting the customization of mung beans (Kim et al., 2010; Pipan et al., 2023; Somta et al., 2022; Yimram et al., 2009). This study assessed the diversity of thirteen important qualitative agronomical characteristics. Appendix 3 (Supplementary material) details the distinct features of all the mung bean accessions in relation to each agronomic trait, whereas Table 1 summarizes their frequency distribution.
Table 1.
Distribution of qualitative agronomical traits across 329 mung bean accessions of different origins grown in Korea.
| Trait | States | Frequency (Re. frequency (%)) | Controls | H’t | ||||||||
| Total | China | India | Korea | 1z | 2y | 3x | 4w | 5v | 6u | |||
| Hypocotyl color | Purple green | 127 (38.60) | 19 | 49 | 59 | √ | 0.76 | |||||
| Light purple | 145 (44.89) | 69 | 32 | 44 | ||||||||
| Purple | 2 (0.62) | 0 | 2 | 0 | ||||||||
| Green | 49 (15.17) | 10 | 17 | 22 | √ | √ | √ | √ | √ | |||
| Growth type | Determinate | 228 (70.59) | 73 | 66 | 89 | √ | √ | √ | √ | √ | 0.72 | |
| Indeterminate | 35 (10.84) | 5 | 14 | 16 | ||||||||
| Semi-determinate | 60 (18.58) | 20 | 20 | 20 | √ | |||||||
| Growth habit | Intermediate | 124 (38.39) | 37 | 41 | 46 | √ | √ | √ | √ | √ | √ | 0.91 |
| Upright | 153 (47.37) | 48 | 47 | 58 | ||||||||
| Semi-upright | 46 (14.24) | 13 | 12 | 21 | ||||||||
| Pubescence density of pod | High | 82 (25.39) | 33 | 23 | 26 | 0.98 | ||||||
| Low | 135 (41.80) | 31 | 32 | 72 | √ | √ | √ | |||||
| Medium | 106 (32.82) | 34 | 45 | 27 | √ | √ | √ | |||||
| Terminal leaflet shape | Cordate | 319 (98.76) | 98 | 96 | 125 | √ | √ | √ | √ | √ | 0.11 | |
| Hastate | 4 (1.24) | 0 | 4 | 0 | √ | |||||||
| Petiole color | Purple-green | 253 (78.33) | 81 | 80 | 92 | 0.50 | ||||||
| Green | 52 (16.10) | 16 | 12 | 24 | √ | √ | √ | √ | √ | √ | ||
| Purple | 3 (0.93) | 0 | 3 | 0 | ||||||||
| Pale purple | 15 (4.64) | 1 | 5 | 9 | ||||||||
| Flower color | Purple-yellow | 309 (95.67) | 97 | 97 | 115 | √ | √ | √ | √ | 0.28 | ||
| Yellow | 14 (4.33) | 1 | 3 | 10 | √ | √ | ||||||
| Pod color | Dark brown | 105 (32.51) | 36 | 24 | 45 | 0.65 | ||||||
| Black | 128 (39.63) | 49 | 25 | 54 | √ | √ | √ | √ | √ | |||
| Brown | 67 (20.74) | 9 | 47 | 11 | √ | |||||||
| Yellowish brown | 8 (2.48) | 1 | 3 | 4 | ||||||||
| Yellow | 4 (1.24) | 1 | 0 | 3 | ||||||||
| Pale yellow | 6 (1.86) | 2 | 1 | 3 | ||||||||
| Other | 3 (0.93) | 0 | 0 | 3 | ||||||||
| Mixed | 2 (0.62) | 0 | 0 | 2 | ||||||||
| Pod curvature | Straight | 247 (76.47) | 67 | 87 | 93 | √ | √ | √ | √ | √ | 0.78 | |
| Moderate | 76 (23.53) | 31 | 13 | 32 | √ | |||||||
| Seed shape | Oblate spheroidal | 157 (48.61) | 15 | 64 | 78 | √ | √ | √ | 0.77 | |||
| Cylindrical | 44 (13.62) | 3 | 23 | 18 | √ | |||||||
| Mixed | 6 (1.86) | 1 | 2 | 3 | ||||||||
| Oval | 116 (35.91) | 79 | 11 | 26 | √ | √ | ||||||
| Seed color | Yellow | 13 (4.02) | 3 | 2 | 8 | √ | √ | 0.27 | ||||
| Green | 294 (91.02) | 94 | 92 | 108 | √ | √ | √ | √ | ||||
| Mixed | 5 (1.55) | 0 | 2 | 3 | ||||||||
| Dark brown | 5 (1.55) | 0 | 1 | 4 | ||||||||
| Brown | 6 (1.86) | 1 | 3 | 2 | ||||||||
| Seed dot | Absent | 306 (94.74) | 97 | 89 | 120 | √ | √ | √ | √ | √ | √ | 0.21 |
| Black | 13 (4.02) | 0 | 10 | 3 | ||||||||
| Dark brown | 4 (1.24) | 1 | 1 | 2 | ||||||||
| Seed coat surface luster | Gloss | 141 (43.65) | 81 | 48 | 12 | √ | √ | 0.65 | ||||
| Absent | 180 (55.73) | 17 | 50 | 113 | √ | √ | √ | √ | ||||
| Mixed | 2 (0.62) | 0 | 2 | 0 | ||||||||
Seven of the thirteen qualitative traits were dominated by a single state, while the remaining six traits had two or more dominant characteristics in the whole population. For example, the most common hypocotyl color was light purple (44.89%), followed by purple-green (39.32%). Similarly, the majority of the genotypes had an upright growth habit (47.37%), with intermediate (38.39%) being the next most common. In terms of pod color, black (39.63%) was the dominant color, followed by dark brown (32.51%) and brown (20.74%) colors. The most dominant seed shape was oblate spheroidal (48.61%), followed by oval (35.91%). The growth type was one of the traits that had a single dominant state, with 70.59% of the genotypes displaying an indeterminate growth type. Similarly, 98.76% of the mung bean genotypes had a cordate terminal leaf shape, 78.33% had a purple-green petiole color, 76.47% had a straight pod curvature, 91.02% had a green seed color, and 94.74% had no seed dot. While most mung bean genotypes did not have a seed coat surface lust, 43.65% had a gloss luster. The control cultivars also showed little to no variance in most of these agricultural traits. However, it is important to note that certain traits like growth habit and petiole color displayed variations between the whole population and the controls. The extent of diversity in the qualitative agronomical traits was evaluated using the H' index. In general, a higher H' indicates greater diversity, while a lower H' suggests less diversity (Rabara et al., 2014). The traits influenced by a single characteristic, such as terminal leaflet shape, flower color, seed color, growth type, petiole color, pod curvature, and seed dot, had either low (H': 0.01-0.46) or moderate (H': 0.46-0.75) diversity indices (Table 1). On the other hand, traits with two or more dominant states, such as hypocotyl color, growth habit, pubescence density of pod, seed shape, pod color, and seed coat surface lust, had high diversity indices (H': 0.76-0.99). Previously, several studies have investigated the diversity of mung bean genetic materials using qualitative agronomical traits. For instance, Rahangdale et al. (2023) recently studied 40 different mung bean genotypes grown in India. Their findings revealed that the majority of these genotypes exhibited brown-colored pods with a straight curvature, which corresponds with our observations. The same study revealed that light green seed color, shiny (gloss) seed luster, and oval seed shape were also the dominant characteristics in their respective category. In another study, the dominance of purple hypocotyl color, black pod color, green seed coat color, and spotless seeds was reported across 340 mung bean accessions grown in Thailand (Yimram et al., 2009). In support of our findings, Azam et al. (2023) found high H' indices for pod curvature (0.679) and pod color (0.927) across 166 mung bean germplasms grown in Bangladesh. However, in contrast to our findings, this study discovered much higher H' values for seed color (1.279) and terminal leaflet shape (0.592), suggesting the presence of two or more dominant states. In general, the qualitative characteristics found in our study align with previous findings, even though their frequency distribution differs (Azam et al., 2023; Jena et al., 2017; Rahangdale et al., 2023; Yimram et al., 2009). Such discrepancies in the relative distributions of specific characteristics among studies could be attributed to variations in the number of accessions studied, differences in genotypes, and variations in growth conditions, among other factors (Islam et al., 2021a; Nair et al., 2019). Moreover, the existence of wide-ranging features in some of the traits gives several options to identify genotypes with desired qualities, leading to an opportunity to investigate their genetic variation at the molecular level (Ha et al., 2021; Sandhu and Singh, 2020; Somta et al., 2022).
Variations of quantitative agronomic traits
In this study, a total of nine quantitative traits were recorded for each of the mung bean accessions (Appendix 4, Supplementary material). Table 2 illustrates the variations of these characteristics within the whole mung bean population, as well as details about their relative distribution. LR exhibited the highest diversity, with a coefficient of variation (CV) of 79.91%. This was followed by PPP and HSW which had CVs of 41.23% and 36.56%, respectively. On the other hand, DM, GR, and SPP were the traits with the lowest diversity and had CVs of 8.76%, 9.27%, and 10.92%, respectively. In terms of distribution, GR, DFM, DM, and SPP were negatively skewed, while the other traits were positively skewed. LR was the only trait with a negative kurtosis, whereas HSW had the highest positive value. Overall, the quantitative traits displayed wide variability and distribution patterns, indicating genetic variances among the mung bean accessions (Zhao et al., 2022).
Table 2.
Variations of quantitative agronomical traits across 329 mung bean accessions of different origins grown in Korea.
| Variable | Origin | Frequency | Min. | Max. | Meanq | SDp | CVo (%) | Skewness | Kurtosis |
| GRr (%) | China | 98 | 66.67 | 100.00 | 97.26a | 4.82 | 4.96 | -1.93 | 3.81 |
| India | 100 | 60.00 | 100.00 | 90.97b | 9.67 | 10.63 | |||
| Korea | 125 | 60.00 | 100.00 | 92.41ab | 9.14 | 9.89 | |||
| Cultivars | 6 | 76.67 | 100.00 | 90.00b | 8.61 | 9.56 | |||
| Total | 329 | 60.00 | 100.00 | 93.37 | 8.65 | 9.27 | |||
| PHs (㎝) | China | 98 | 70.00 | 161.00 | 110.82b | 13.71 | 12.37 | 0.53 | 0.77 |
| India | 100 | 78.00 | 181.33 | 127.92a | 22.29 | 17.43 | |||
| Korea | 125 | 82.00 | 198.33 | 123.70a | 18.83 | 15.22 | |||
| Cultivars | 6 | 79.00 | 110.67 | 96.44b | 11.27 | 11.68 | |||
| Total | 329 | 70.00 | 198.33 | 120.65 | 20.03 | 16.60 | |||
| DFt (Days) | China | 98 | 31.00 | 58.00 | 41.12b | 3.70 | 9.00 | 1.71 | 2.61 |
| India | 100 | 34.00 | 80.00 | 47.04a | 8.99 | 19.11 | |||
| Korea | 125 | 37.00 | 71.00 | 46.18a | 8.86 | 19.19 | |||
| Cultivars | 6 | 34.00 | 40.00 | 38.00b | 2.24 | 5.88 | |||
| Total | 329 | 31.00 | 80.00 | 44.78 | 8.09 | 18.05 | |||
| DFMu (Days) | China | 98 | 37.00 | 72.00 | 53.28a | 6.43 | 12.07 | -0.49 | 0.19 |
| India | 100 | 22.00 | 63.00 | 42.69c | 8.73 | 20.45 | |||
| Korea | 125 | 22.00 | 66.00 | 45.55b | 8.75 | 19.21 | |||
| Cultivars | 6 | 23.00 | 56.00 | 37.83c | 11.85 | 31.33 | |||
| Total | 329 | 22.00 | 72.00 | 46.84 | 9.30 | 19.85 | |||
| DMv (Days) | China | 98 | 80.00 | 110.00 | 94.24a | 4.97 | 5.27 | -1.49 | 4.82 |
| India | 100 | 57.00 | 110.00 | 89.69b | 9.28 | 10.35 | |||
| Korea | 125 | 61.00 | 110.00 | 91.65b | 7.26 | 7.92 | |||
| Cultivars | 6 | 57.00 | 95.00 | 75.67c | 13.20 | 17.44 | |||
| Total | 329 | 57.00 | 110.00 | 91.53 | 8.02 | 8.76 | |||
| LRw (%) | China | 98 | 0.00 | 78.57 | 33.09a | 21.48 | 64.90 | 0.60 | -0.39 |
| India | 100 | 0.00 | 93.33 | 25.04b | 18.91 | 75.51 | |||
| Korea | 125 | 0.00 | 73.33 | 20.37b | 18.43 | 90.45 | |||
| Cultivars | 6 | 0.00 | 69.23 | 13.76b | 24.99 | 181.57 | |||
| Total | 329 | 0.00 | 93.33 | 25.46 | 20.34 | 79.91 | |||
| PPPx (n) | China | 98 | 22.67 | 137.67 | 62.46b | 22.35 | 35.79 | 1.15 | 2.64 |
| India | 100 | 24.00 | 236.33 | 92.88a | 38.14 | 41.07 | |||
| Korea | 125 | 12.00 | 148.67 | 74.63ab | 26.49 | 35.50 | |||
| Cultivars | 6 | 57.33 | 115.33 | 84.33a | 17.42 | 20.66 | |||
| Total | 329 | 12.00 | 236.33 | 76.73 | 31.64 | 41.23 | |||
| SPPy (n) | China | 98 | 9.50 | 13.60 | 11.44a | 0.91 | 7.98 | -0.10 | 1.65 |
| India | 100 | 6.60 | 14.20 | 10.93a | 1.28 | 11.67 | |||
| Korea | 125 | 7.70 | 17.00 | 11.52a | 1.35 | 11.70 | |||
| Cultivars | 6 | 9.20 | 13.00 | 10.83a | 1.22 | 11.29 | |||
| Total | 329 | 6.60 | 17.00 | 11.30 | 1.23 | 10.92 | |||
| HSWz (g) | China | 98 | 3.87 | 8.23 | 6.35a | 1.14 | 17.91 | 4.16 | 42.81 |
| India | 100 | 2.00 | 7.17 | 3.94c | 1.04 | 26.39 | |||
| Korea | 125 | 2.37 | 25.10 | 4.77b | 2.13 | 44.62 | |||
| Cultivars | 6 | 5.17 | 7.17 | 5.96ab | 0.75 | 12.63 | |||
| Total | 329 | 2.00 | 25.10 | 5.01 | 1.83 | 36.56 |
The GR in the entire population ranged from 60.00% to 100.00%, with an average of 93.37%. Only 18 accessions had a lower GR than all the controls (< 76.67%). In contrast, 117 accessions displayed a 100% GR, signifying their ability to adapt to the Korean environment. The PH ranged from 70.00-198.33 ㎝, with an average of 120.65 ㎝. Among all the mung bean accessions, the majority (n = 219) had a PH higher than all of the controls (> 111 ㎝). In contrast, four accessions were found to have a PH lower than all of the controls (< 79 ㎝). Our observation was consistent with a previously reported PH range of 48.00-129.60 ㎝ (Zhao et al., 2022). In contrast, PH in the ranges of 57-80 ㎝ (Kim et al., 2018b) and 19.90-80.00 ㎝ (Yimram et al., 2019) were reported, each being narrower than our findings. PH is highly associated with yield and is greatly influenced by environmental factors. Therefore, the observation of wide ranges of PH in this study could be an input to select genotypes with desirable properties (Yimram et al., 2019).
Regarding the growth period-related traits, DF and DM varied from 31.00 to 80.00 days and 57.00 to 110.00 days, respectively. Compared to our study, a narrower DM range (50 to 64 days) was previously observed in mung bean genotypes grown in different environments in India (Manjunatha et al., 2023). Similarly, Islam et al. (2021b) found narrower ranges for DF (34-48 days) and DM (56-74 days). Zhao et al. (2022) also reported a DM range of 65-87 days. Despite these discrepancies, some accessions in our study exhibited similar DF and DM values as those reported in these previous studies. Among the controls, Samhwang (57 days) was the earliest to mature followed by Jinhwang (61 days), and Eoul (75 days). None of the mung bean accessions matured earlier than Samhwang. However, one accession, IT-189549, had the same DM as Samhwang, while another accession, IT-26223, with a DM of 58 days, matured earlier than all other controls except Samhwang. Additionally, three other accessions, IT-189565, IT-163211, and IT-180833), each taking 61 days to mature, along with IT104861 and IT-189548 also matured earlier than all the controls except for Samhwang and Jinhwang. Early maturing mung bean accessions hold significant value in breeding programs and are advantageous for farmers, making these early maturing accessions crucial resources (Sandhu and Singh, 2020; Somta et al., 2022).
Crop yields can be greatly affected by the occurrence of lodging, making cultivars with low LR highly valuable (Kim et al., 2018b). The LR in this study ranged from 0.00% to 93.33%, with an average of 25.46%. A total of 56 accessions had 0.00% LR, which was similar to the three control cultivars (Dahyeon, Eoul, and Seonhwanokdu). However, seven accessions exhibited higher LR than all the controls, surpassing 69%. Overall, the accessions that had strong resistance to lodging possess significant potential for developing varieties with reduced LR. Other traits associated with yield, such as PPP, SPP, and HSW, also play significant roles in mung bean breeding program. In this study, PPP and SPP were in ranges of 12.00-236.33 and 6.60-17.00, respectively, with average values of 76.73 and 11.30. Likewise, HSW ranged from 2.00 to 25.10 g, with an average of 5.01 g. Previously, Yimram et al. (2009) reported a comparable SPP range (7.68-14.30), while the PPP reported (5.30-34.40) was less broad. Other studies also documented PPP in the ranges of 9.64-38.03 (Islam et al., 2021b) and 1.30-41.70 (Zhao et al., 2022). A recent study by Nana et al. (2023) found a PPP in the ranges of 29.33-149.33 across fifteen accessions grown in Burkina Faso. Overall, the observed values were comparable with many of these previous studies although a few accessions (Appendix 4) displayed a much higher PPP (>150) which could arise due to the difference in genotype (Yimram et al., 2009). These previous studies similarly revealed HSW values that fell within the range observed in our study (Islam et al., 2021b; Yimram et al., 2009; Zhao et al., 2022). When compared to the control cultivars, 34 accessions demonstrated higher PPP, 11 accessions exhibited higher SPP, and 25 accessions displayed higher HSW. Conversely, 90 accessions had lower PPP, 14 accessions had lower SPP, and 196 accessions had lower HSW (Appendix 2). In summary, wide variability was observed in the quantitative traits across the mung bean accessions, providing several options for selecting superior genotypes.
Effect of origin on qualitative and quantitative agronomical traits
Previous studies signified the impact of origin on the agronomic traits as well as metabolite compositions of several crops, including legumes (Dong et al., 2019; Huppertz et al., 2023; Zhao et al., 2020). Different research centers and genebanks with a large collection of mung bean genetic resources also attempted to investigate their agronomical variations based on origin although such studies are still limited (Burlyaeva et al., 2019; Gayacharan et al., 2020; Sandhu and Singh, 2020; Schafleitner et al., 2015). In this study, the variation of each agronomical trait with respect to origin was analyzed. As shown in Table 1, most of the qualitative agronomical traits exhibited minimal variations across the three countries of origin. For instance, determinate growth type, upright growth type, and cordate terminal leaflet shape were dominant in Chinese, Korean, and Indian accessions. Similarly, regardless of origin, the mung bean accessions displayed dominant traits such as purple-green petiole color, purple-yellow flower color, green seed color, and straight pod curvature. However, there were distinctions observed in the hypocotyl color, with Chinese accessions primarily displaying a light purple color, while Indian and Korean accessions showcased a purple-green color. Additionally, black pod color was dominant in Chinese and Korean accessions, while brown pod color was widespread in the majority of Indian accessions. Regarding seed shape, an oval shape with a glossy seed coat surface was dominant in Chinese accessions, whereas an oblate spheroidal shape with no seed coat surface lust was dominant in Indian and Korean accessions. In conclusion, our observations indicated that the country of origin may not serve as a reliable parameter for discriminating mung bean genotypes using qualitative agronomical traits. Nevertheless, the traits that displayed discrepancies among the countries of origin may be crucial when examining a diverse collection of mung bean genetic resources (Zhao et al., 2020).
Previous studies that investigated the effect of origin on quantitative traits in mung beans did not support their observation using statistical analysis (Burlyaeva et al., 2019; Gayacharan et al., 2020; Sandhu and Singh, 2020; Schafleitner et al., 2015). In this study, the effect of origin on each of the nine quantitative agronomical traits was statistically analyzed (Table 2). The results revealed that origin had a significant effect on all of the quantitative traits except SPP. Chinese accessions had the highest average GR, while Indian accessions had the lowest (p < 0.05). However, all three countries of origin had an average GR of at least 90.00%, indicating that mung bean accessions are adaptable to the Korean environment. The PH followed an opposite pattern to GR, the average PH being the highest in Indian accessions and the lowest in Chinese accessions. Likewise, Indian accessions had the shortest maturity period with an average DM of 89.69 days, whereas Chinese accessions had the longest with an average DM of 94.24 days. Nonetheless, none of the countries had a lower average PH and DM than the control cultivars (p < 0.05). Once again, Chinese accessions exhibited the highest average LR (33.09%), which was significantly different from the average LR observed in the Korean (20.37%) and Indian (25.04%) accessions (p < 0.05). When it comes to yield-related characteristics, Indian accessions demonstrated the highest average PPP (92.88), but the lowest average HSW (3.94 g). Conversely, Chinese accessions showed the highest average HSW (6.35 g) and the lowest average PPP (62.46) (p < 0.05). Though not statistically significant, the average SPP decreased in the order of Korea (11.52) > China (11.44) > India (10.93). Overall, our result signified that origin could be a determinant factor in the analysis of a large collection of mung bean genotypes using quantitative traits (Zhao et al., 2020).
Multivariate analysis
Several multivariate statistical techniques such as hierarchical cluster analysis (HCA), principal component analysis (PCA), and correlation analysis are used in characterizing a large collection of plant genetic materials (Azam et al., 2023; Ghafoor et al., 2002; Lee et al., 2021). To gain a more profound understanding of the distribution of the mung bean accessions and their connection with the analyzed parameters, both HCA and PCA were conducted utilizing the complete dataset. Moreover, PCA using mixed qualitative and quantitative data (PCAmix) was also utilized to examine the degree to which qualitative traits contribute to the observed diversity among the mung bean accessions. Pearson’s correlation analysis was computed to investigate the correlation between the quantitative agronomical traits.
The HCA divided the mung bean accessions into four major clusters and their respective sub-groups (Fig. 1A). Cluster I consisted of 101 accessions, while clusters II, III, and IV contained 25, 49, and 148 accessions, respectively. Chinese accessions dominated cluster IV, while Indian and Korean accessions were abundant in the other clusters. As shown in Fig. 1B, there was significant variation in all the quantitative traits between the clusters, except for LR and SPP (p < 0.05). Cluster I had the lowest average GR (87.59%) and the highest average PPP (98.84). Conversely, cluster IV had the highest average GR (96.70%), the lowest PPP (63.26), and the highest average HSW (6.17 g). Additionally, cluster II consisted of accessions that matured early, with an average DM of 74.72 days. The PCA also corroborated the findings of the HCA and generated three components with an eigenvalue greater than 1 (Table 3). The first two principal components, PC1 and PC2, accounted for approximately 48% of the total variance observed. The score plot exhibited that the PCA classified the mung bean accessions based on their cluster along the PC1 and PC2 axes (Fig. 1C). Nevertheless, the PCA based on origin did not distinctly differentiate the mung bean accessions, although the majority of the Chinese accessions were grouped on the right side of PC1 axis (Fig. 1D). The loading plot also indicated that the grouping of the variables matched their clustering pattern in the HCA (Fig. 1E). PH, DF, DFM, and HSW had FL of greater than 0.5, and were the major contributor for the variance observed along PC1. Likewise, DM and PPP were the major contributors along PC2. GR had comparable contributions along both PC1 and PC2 (Table 3). In general, the PCA along with the HCA further signified the importance of quantitative agronomical traits in the categorization of large mung bean genetic materials. In the mixed PCA (Fig. 2), the mung bean accessions showed a relatively clear separation according to their origin despite the low total variance contributed by PC1 (9.49%) and PC2 (6.98%). This observation further signifies the importance of qualitative agronomical traits in the characterization of a large collection of plant genetic materials (Marzario et al., 2023).
Table 3.
Individual and cumulative variance of principal components with Eigen values greater than 1 and contribution of quantitative traits in the PCA.
|
Principal components | Contributions | Variables | Eigen-values |
Variability (%) |
Cumulative variance (%) | ||||||||
| zGR | yPH | xDF | wDFM | vDM | uLR | tPPP | sSPP | rHSW | |||||
| PC1 | FL | 0.25 | -0.71 | -0.79 | 0.81 | 0.14 | -0.03 | -0.2 | -0.14 | 0.66 | 2.37 | 26.30 | 26.30 |
| % | 2.74 | 21.23 | 26.38 | 28.03 | 0.82 | 0.03 | 1.61 | 0.84 | 18.32 | ||||
| PC2 | FL | 0.22 | 0.41 | 0.48 | 0.23 | 0.74 | 0.43 | -0.69 | 0.34 | 0.38 | 1.98 | 21.99 | 48.99 |
| % | 2.44 | 8.61 | 11.46 | 2.57 | 27.84 | 9.54 | 24.35 | 5.91 | 7.28 | ||||
| PC3 | FL | -0.4 | 0.19 | 0.08 | 0.45 | 0.61 | -0.31 | 0.27 | -0.46 | -0.27 | 1.22 | 13.59 | 61.88 |
| % | 13.28 | 2.82 | 0.52 | 16.72 | 30.09 | 7.81 | 5.91 | 17.01 | 5.84 | ||||
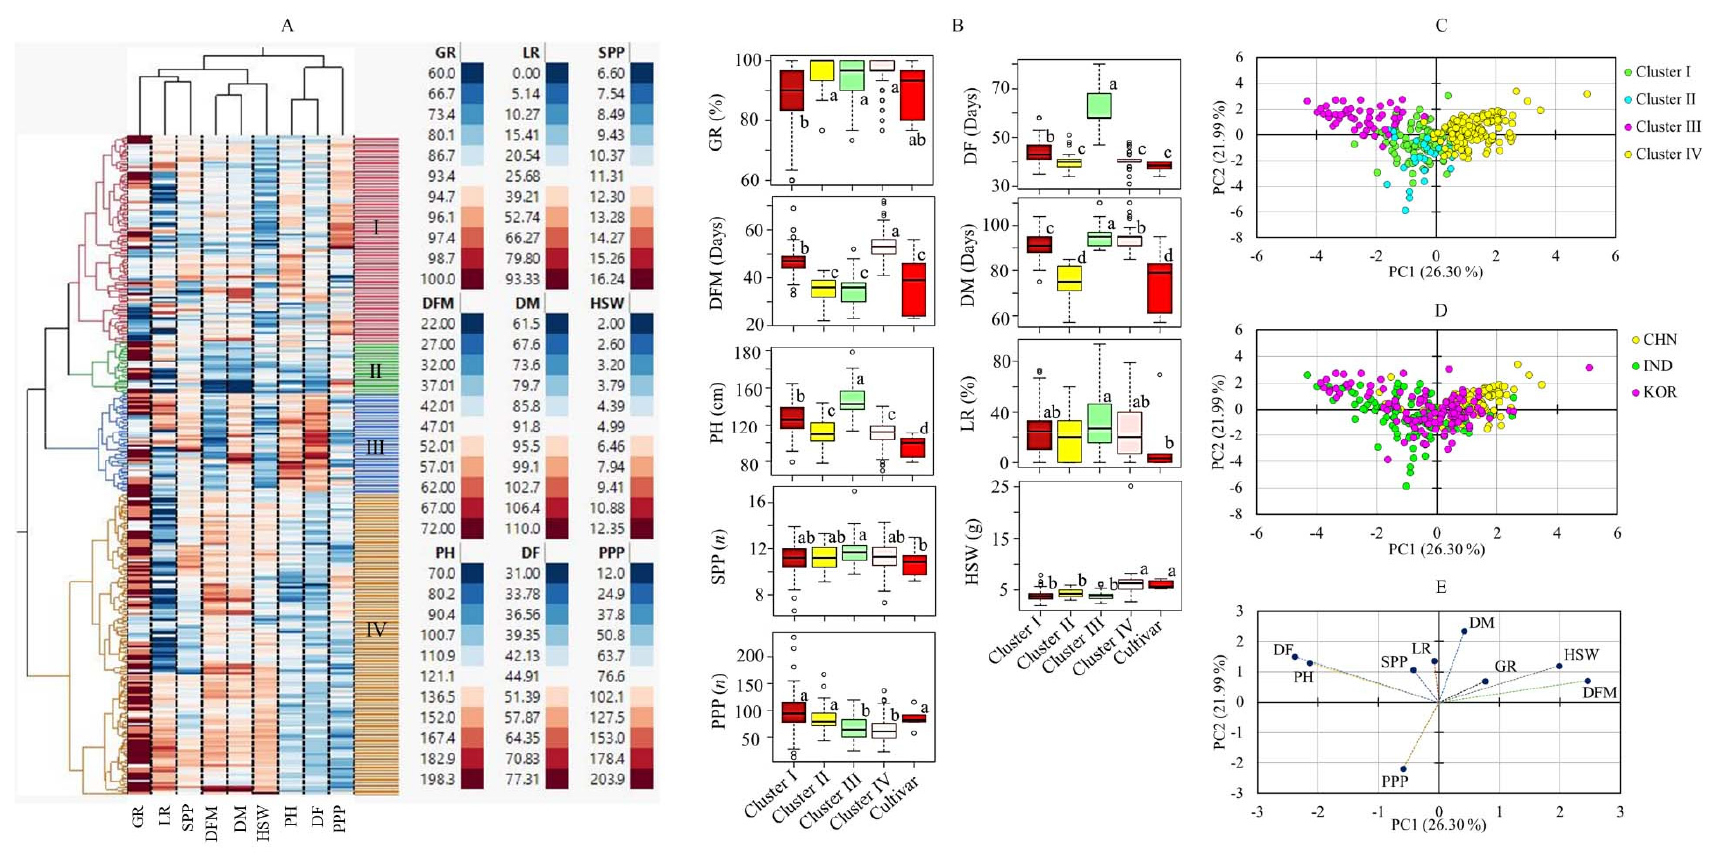
Fig. 1.
Hierarchical cluster analysis matrix (A), boxplots showing the variations of quantitative traits between clusters (B), score plots of mung bean accessions from principal component analysis based on cluster (C) and origin (D), and loading plot of variables (E). DF: Days to flowering, DFM: Days from flowering to maturity, DM; Days to maturity, GR: rate of germination, HSW: One-hundred seeds weight, LR: lodging rate, PPP: Number of pods per plant, SPP: number of seeds per pod. Different letters on boxplots in a category indicate significantly different means (p < 0.05).
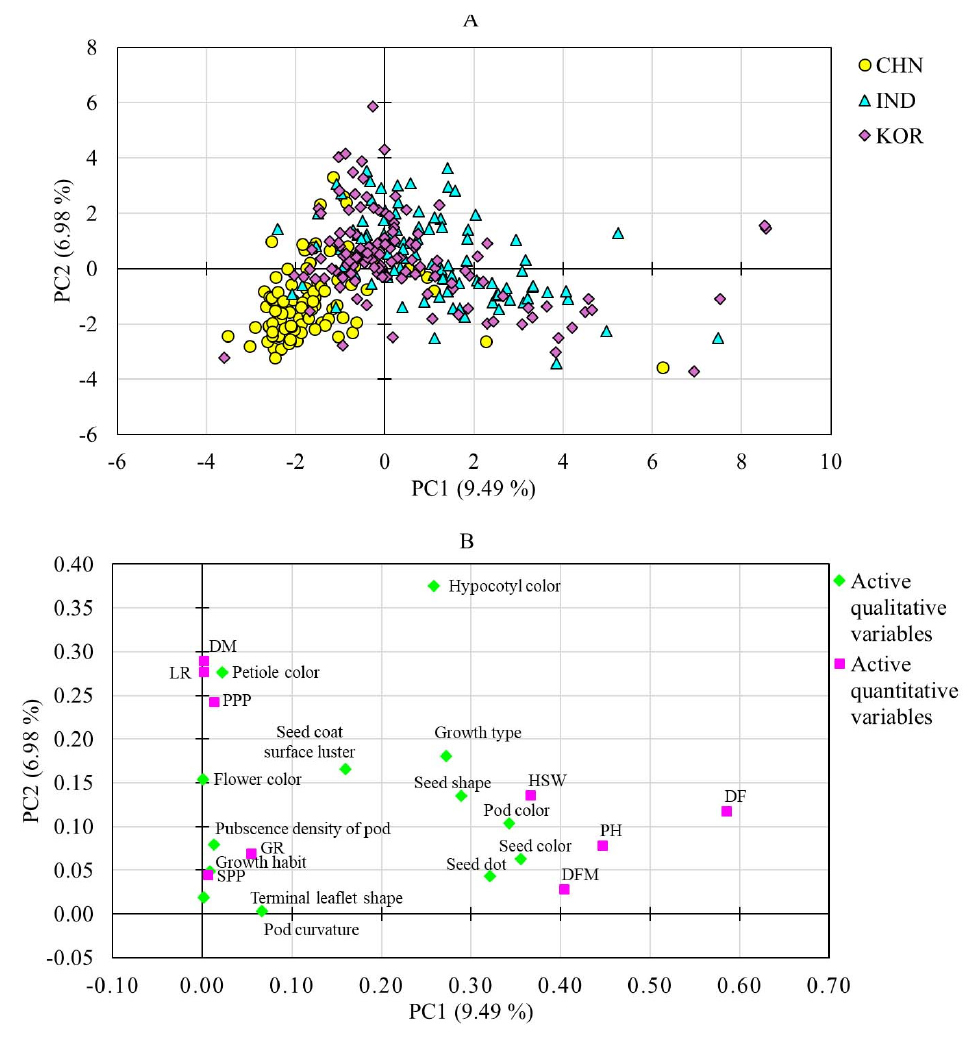
Fig. 2.
Score map of mung bean accessions (A) and loading chart of variables (B) obtained from principal component analysis using mixed qualitative and quantitative data (PCAmix). DF: Days to flowering, DFM: Days from flowering to maturity, DM; Days to maturity, GR: rate of germination, HSW: One-hundred seeds weight, LR: lodging rate, PPP: Number of pods per plant, SPP: number of seeds per pod.
Pearson’s correlation analysis was conducted to view the association of quantitative variables across mung bean genotypes according to their origin, and some significant associations were observed (Fig. 3). LR had a weak correlation with PH in Indian (r = 0.05) and Chinese (r = 0.02) accessions but showed a relatively stronger correlation in Korean accessions (r = 0.32) although each of these correlations was not significant. Regardless of origin, and in the total population, PH had a strong and positive correlation with DF (r ≥ 0.52) at various significance levels. Likewise, PH showed weak correlations with other yield-related components including PPP, SPP, and HSW regardless of origin (-0.28 ≤ r ≤ 0.25). Previous studies also found comparable associations of PH with DF, PPP, SPP, and HSW (Azam et al., 2023; Sandhu and Singh, 2020; Zhao et al., 2022). PPP and HSW also showed negative correlations in Korean (r = -0.16), Chinese (r = -0.63, p < 0.001), and Indian (r = -0.40, p < 0.5) accessions, as well as in the whole population (r = -0.41, p < 0.05), all except the former being significant. Such a negative association between PPP and HSW has also been previously observed (Gayacharan et al., 2020). In general, the correlation analysis result further strengthens the variables’ clustering observed in the HCA and PCA.
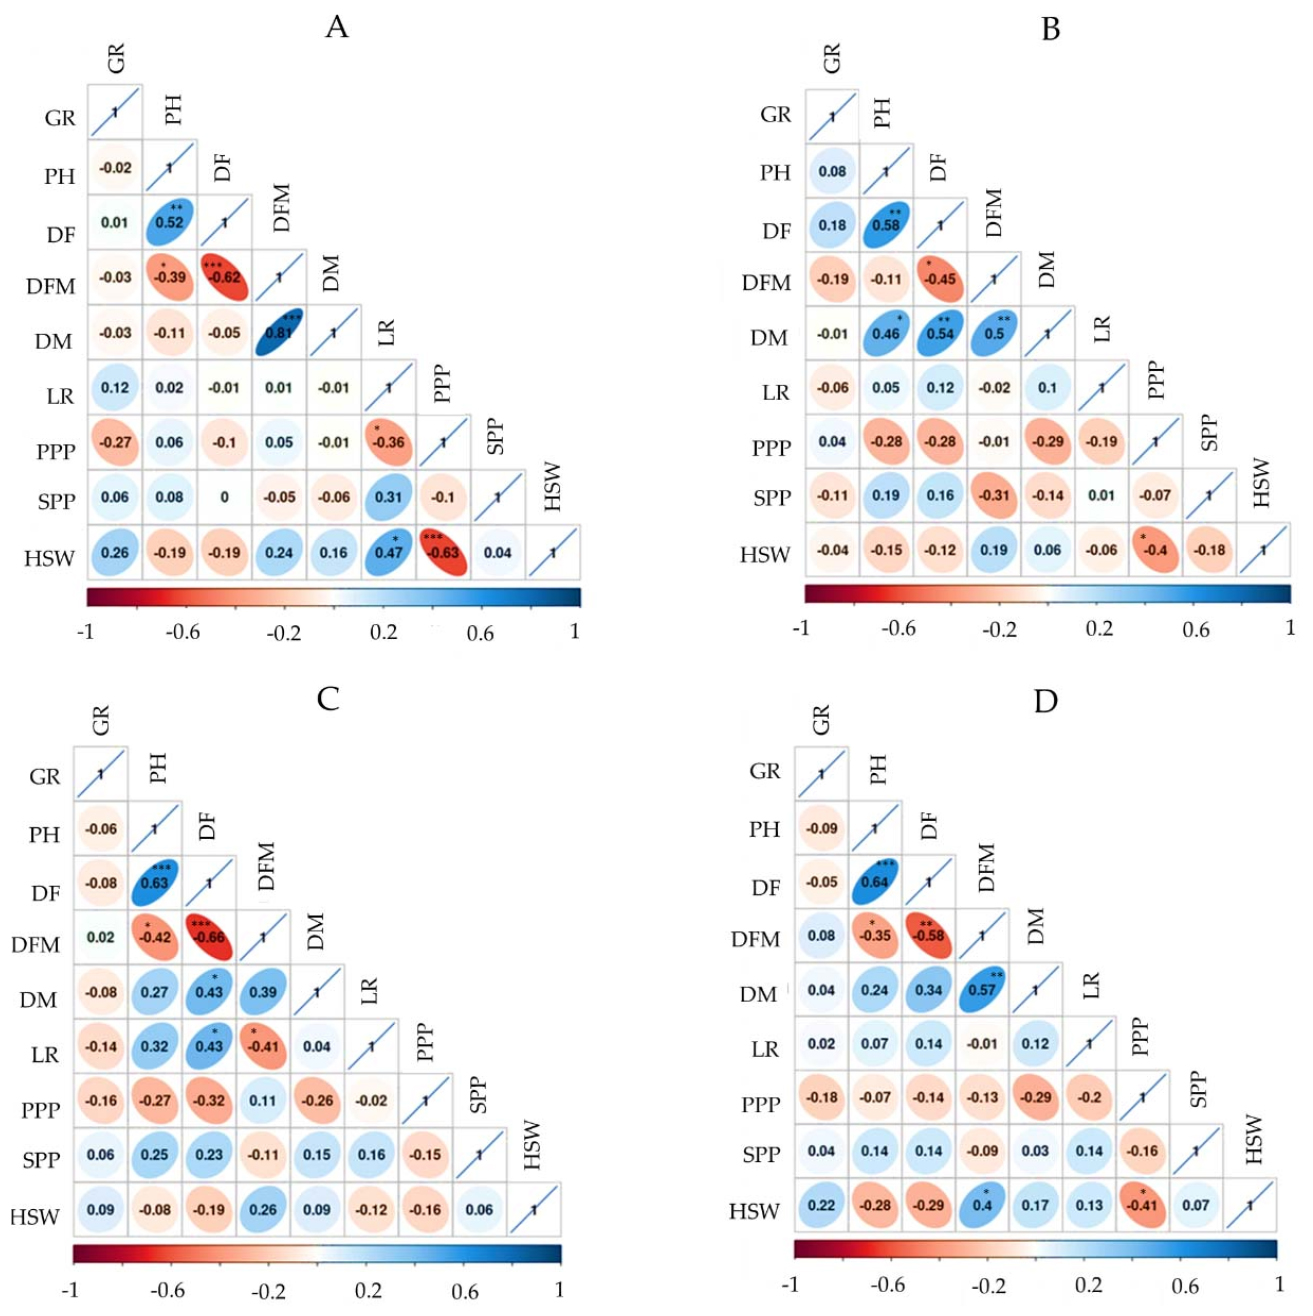
Fig. 3.
Pearson’s correlation matrix showing the association of quantitative agronomical traits in Chinese (A), Indian (B), Korean (C), and total (D) mung bean accessions. DF: Days to flowering, DFM: Days from flowering to maturity, DM; Days to maturity, GR: rate of germination, HSW: One-hundred seeds weight, LR: lodging rate, PPP: Number of pods per plant, SPP: number of seeds per pod. *p < 0.05, **p < 0.01, ***p < 0.001.
In summary, this study examined the genetic diversity of a large collection of mung bean accessions from three different countries that have recently been cultivated in Korea using phenotypic traits. Both qualitative and quantitative agronomical traits showed wide variations, indicating the presence of genetic diversity in the overall population. The study also evaluated the effect of origin on each agronomical trait. Generally, the mung bean accessions exhibited similar proportions in qualitative traits regardless of their origin. However, Chinese accessions were more likely to have light purple hypocotyls compared to Korean and Indian accessions, which predominantly had either purple-green or light purple hypocotyls. Chinese accessions also had oval seed shapes, while Korean and Indian accessions had oblate spheroidal shapes. Regarding seed coat lust, most Chinese accessions had a glossy coat, while it was absent in many Korean accessions. The proportions of glossy and dull seed coat lust were similar in Indian accessions. In terms of quantitative traits, Chinese accessions were shorter in height, later maturing, and had a lower number of seeds per pod, and higher one-hundred seeds weight compared to Indian and Korean accessions. This study also identified several superior accessions (Table 4). Specifically, seven accessions that matured earlier were discovered, and all except two of them originated from India. Moreover, 34 accessions with a greater quantity of pods per plant were identified. It is noteworthy to mention that three of these early maturing accessions (VO3146B-G, V1842, and VO5049A-G) were also included in this category. Additionally, 11 accessions with a higher number of seeds per pod and 25 accessions with a higher hundred-seed weight were identified. Among these, three accessions (VC93429-2, GSI 40169, and Nokdu 3) simultaneously demonstrated a higher number of seeds per pod and one-hundred seeds weight. Overall, these exceptionally well-performed accessions could be utilized in mung bean breeding programs.
Table 4.
Selected mung bean accessions with superior characteristics compared to the control cultivars.
| IT-Number | Origin | Values |
| Early maturing accessions (< 75 days) | ||
| 189549 | India | 57 |
| 26223 | India | 58 |
| 189565 | India | 61 |
| 163211 | India | 61 |
| 180833 | Korea | 61 |
| 104861 | Korea | 62 |
| 189548 | India | 71 |
| Accessions with high PPPx (n > 115) | ||
| 26148 | India | 236 |
| 26220 | India | 216 |
| 261771 | India | 181 |
| 189549 | India | 167 |
| 163185 | India | 155 |
| 189491 | India | 154 |
| 182292 | India | 150 |
| 26219 | India | 150 |
| 163267 | India | 149 |
| 288914 | Korea | 149 |
| 145310 | India | 149 |
| 26223 | India | 145 |
| 26030 | Korea | 144 |
| 189497 | India | 144 |
| 217482 | Korea | 140 |
| 296852 | China | 138 |
| 271511 | Korea | 137 |
| 26201 | India | 137 |
| 26233 | India | 135 |
| 163291 | India | 130 |
| 189511 | India | 128 |
| 189495 | India | 123 |
| 310466 | China | 123 |
| 189565 | India | 123 |
| 102751 | Korea | 122 |
| 26058 | Korea | 121 |
| 333410 | Korea | 120 |
| 145272 | India | 119 |
| 283407 | China | 119 |
| 189513 | India | 118 |
| 164942 | India | 118 |
| 189492 | India | 118 |
| 189518 | India | 118 |
| 296933 | CHN | 116 |
| Accessions with high SPPy (n > 13) | ||
| 225416 | Korea | 17 |
| 278466 | Korea | 14 |
| 163253 | India | 14 |
| 180835 | Korea | 14 |
| 185575 | Korea | 14 |
| 109145 | Korea | 14 |
| 195146 | Korea | 14 |
| 278816 | China | 14 |
| 278467 | Korea | 14 |
| 185563 | Korea | 14 |
| 101085 | Korea | 14 |
| Accessions with high HSWz (> 7.2 g) | ||
| 278436 | Korea | 25.1 |
| 250302 | China | 8.2 |
| 310441 | China | 8.2 |
| 278816 | China | 8.0 |
| 242328 | China | 7.9 |
| 278836 | China | 7.9 |
| 278467 | Korea | 7.9 |
| 278808 | China | 7.7 |
| 278817 | China | 7.7 |
| 242329 | China | 7.7 |
| 296884 | China | 7.7 |
| 278826 | China | 7.7 |
| 278835 | China | 7.6 |
| 296873 | China | 7.6 |
| 242415 | China | 7.5 |
| 310348 | China | 7.5 |
| 293463 | China | 7.5 |
| 278831 | China | 7.5 |
| 278440 | Korea | 7.5 |
| 310420 | China | 7.4 |
| 278818 | China | 7.4 |
| 212108 | China | 7.4 |
| 278807 | China | 7.3 |
| 278844 | China | 7.3 |
| 278655 | China | 7.3 |
