

Introduction
Materials and Methods
Plant materials and investigation of agricultural traits
Extraction of legume seeds
DPPH assay
ABTS assay
FRAP assay
Total phenolic content
Data analysis
Results
Comparison of agronomic traits among three legumes
Comparison of antioxidant activities and total polyphenol content among three legumes
Correlation among agronomic traits, antioxidant activities, and total polyphenol contents of three legumes
Principal component analysis
Hierarchical clustering analysis
Discussion
Introduction
Legume is an important source of nutrients such as protein, starch, dietary fiber, and minerals. It has long been consumed as rich sources of protein in human diets all over the world (Amarowicz and Pegg, 2008; Harlen and Jati, 2018). In addition, legume is a good source of bioactive phenolic compounds for humans. These bioactive compounds play a significant role in many physiological and metabolic processes (Singh et al., 2017). In Korea, various kinds of legumes, such as adzuki beans, com-mon beans, mung beans, and soybeans, are cultivated and produced (KOSIS, 2021). Among them, adzuki beans, common beans, and soybeans are becoming more popular than other legumes cultivated in Korea due to their health benefits (Choi et al., 2017; Kim et al., 2011; Kwak et al., 2013; Lee et al., 2017, 2018, 2020; Sim et al., 2018; Sung et al., 2020).
Because leguminous seeds contain various natural endogenous antioxidants, antioxidant activities and capacities of legumes vary from plant to plant (Amarowicz and Pegg, 2008). Among various methods for measuring antioxidant capacities, total phenol content is one of the main variables for measuring potential antioxidant capacities (Amarowicz and Pegg, 2008; Balasundram et al., 2006; Singh et al., 2017). Phenolic com-pounds contain benzene rings with one or more hydroxyl substituents. They range from simple phenolic molecules to highly polymerized compounds (Velderrain-Rodríguez et al., 2014). Phenolic compounds have many health benefits, including anticarcinogenic, an-ti-thrombotic, anti-ulcer, anti- artherogenic, anti-allergenic, anti-inflammatory, antioxidant, immunemodulating, anti-microbial, cardioprotective, vasodilatory, and analgesic effects (Balasundram et al., 2006; Lin et al., 2016). Heim et al. (2002) have mentioned that antioxidant activity is a major health benefit of phenolic compounds. Phenolic com-pounds can be the main determinant of antioxidant potentials of plant foods. They can be used as natural antioxidants (Parr and Bolwell, 2000).
Reactive oxygen species (ROS) such as superoxide anion, hydroxyl radical, and hydrogen peroxide can cause cytotoxicity (e.g., chromosome aberrations, protein oxidation, and muscle injury) and lead to metabolic and morphologic changes (e.g., increased muscle proteolysis and changes in the central nervous system) in animals and humans (Fang et al., 2002). The use of antioxidants is necessary to prevent ROS from causing undesirable oxidative stress involved in many human diseases. Synthetic antioxidants such as butylated hydroxytoluene (BHT) and butylated hydroxyanisole (BHA) are often used when processing foods. However, they might have side effects (Amarowicz and Pegg, 2008; Fang et al., 2002; Gowri and Vasantha, 2010). Therefore, interest in natural antioxidants is in-creasing.
To estimate antioxidant capacities of plant extracts, various methods such as DPPH (2,2-diphenyl-1-picrylhydrazyl), ABTS (2,2'-azinobis (3-ethylbenzothiazoline 6-sulfonate)), and FRAP (ferric reducing antioxidant potential) assays have been reported (Katalinic et al., 2006; Kim et al., 2011; Lee et al., 2017, 2018; Li et al., 2008). These methods show different results depending on samples and laboratories, although they are significantly correlated with each other (Dudonné et al., 2009; Thaipong et al., 2006). The aim of this study was to determine total phenolic contents and characterize antioxidant activities of three legumes (adzuki beans, common beans, and soybeans) frequently consumed in Korea using DPPH, ABTS, and FRAP assays. In addition, correlations among agricultural traits, antioxidant activities, and TPC were analyzed. Results of this study may provide useful information for legume breeding to find food materials for the production of value-added foods to improve human health.
Materials and Methods
Plant materials and investigation of agricultural traits
A total of 230 adzuki beans, 159 common beans, and 145 black soybeans were obtained from the National Agro-biodiversity Center (NAS) of the Rural Development Ad-ministration (RDA), Republic of Korea (http://genebank.rda.go.kr) (Supplementary Table 1). Three legumes were harvested in the experimental field in 2017 using conventional cultural practices implemented by the NAS. Days to 50% flowering (FD), days to maturity (MD), days to growth (GD), and 100-seed weight of each legume were investigated.
Table 1.
Average values of agronomic traits, antioxidant activities, and total polyphenol contents of three legumes
| FDz (day) | MDz (day) | GDz (day) | 100-SWz (g) | |
| ABy | 72.9±4.7 a | 51.4±5.6 b | 124.3±4.1 b | 14.2±3.4 c |
| CBy | 37.6±7.4 c | 40.7±7.3 c | 78.3±4.9 c | 33.4±8.9 a |
| SBy | 62.5±6.5 b | 76.1±7.1 a | 138.6±10 a | 25.8±8.3 b |
| DPPH (1/IC50) | ABTS (㎎AAE/g) | FRAP (㎎AAE/g) | TPCz (㎎GAE/g) | |
| AB | 0.056±0.019 a | 2.36±0.49 a | 2.22±0.95 a | 4.15±1.86 a |
| CB | 0.012±0.004 b | 1.19±0.24 b | 1.57±0.47 b | 1.43±0.32 c |
| SB | 0.011±0.003 b | 1.23±0.30 b | 1.52±0.62 b | 2.43±0.70 b |
Extraction of legume seeds
One hundred milligrams (㎎) of each ground sample was added to 1 milliliter (mL) of 75% ethanol (EtOH) and sonicated for 1 hour. The mixture was then centrifuged at 13,000 rpm for 10 minute (min) (R5425, eppendorf, Germany). The clear supernatant was collected into a new tube and used for total phenolic content and antioxidant activity assays.
DPPH assay
DPPH radical-scavenging activities of extracts were assessed using the method of Lee et al. (2016) with some modifications. Briefly, 150 microliter (μL) of 150 micromol (μM) DPPH solution in anhydrous EtOH was added to 100 μL of sample solution. The mixture was shaken vigorously and left to stand at 25℃ in the dark for 30 min. Absorbance was measured at 517 ㎚ using a spectrophotometer (Epoch; Bio-Tek, Winooski, VT, USA). Results are ex-pressed as 1/IC50 (the concentration that inhibits 50% of DPPH radical scavenging activity).
ABTS assay
ABTS radical-scavenging activity was estimated using the method of Lee et al. (2016) with some modifications. Briefly, ABTS radical cation was generated by adding 7 mM ABTS to 2.45 mM potassium persulfate, followed by an overnight incubation at 25℃ in the dark. The ABTS radical cation solution was diluted with methanol (MeOH) to obtain an absorbance of 0.7±0.02 at 735 ㎚. The diluted ABTS radical cation solution (190 μL) was mixed with 10 μL of the sample solution. After 6 min of incubation at room temperature, the absorbance was measured at 735 ㎚. ABTS activity was reported as milligrams of ascorbic acid equivalents (AAE) per gram of sample (dry weight) (㎎ AAE g - 1 dry seed).
FRAP assay
The reducing power of each soybean mutant line was determined with the method of Lee et al. (2016). Briefly, 0.1 mL aliquot of the extract was mixed with 0.5 mL phosphate buffer (0.2 M, pH 6.6) containing 1% K3Fe(CN)6. The mixture was incubated at 50℃ for 20 min. After the mixture was centrifuged at 200 g for 10 min, the top layer (10 µL) was mixed with 390 µL of 1% ferric chloride. The absorbance was then monitored at 700 ㎚. FRAP activity was reported as milligrams of ascorbic acid equivalents (AAE) per gram of sample (dry weight) (㎎ AAE g - 1 dry seed).
Total phenolic content
Total polyphenol content was measured using the method of Lee et al. (2016). Briefly, Folin–Ciocalteu reagent (100 μL) was added to 100 μL of sample solution and reacted at room temperature for 3 min. After adding 100 μL 2% sodium carbonate, the mixture was incubated at room temperature for 30 min. Absorbance was then measured at 750 ㎚ with distilled water as blank. Total phenolic content was reported as milligrams of gallic acid equivalents (GAE) per gram of sample (dry weight) (㎎ GAE g - 1 dry seed).
Data analysis
All data were collected from three replicate experiments. They are expressed as mean±standard deviation. Duncan’s multiple-range test was used to detect significant differences. Correlation analysis and hierarchical clustering analysis were performed using R statistical software (R Core Team, 2020). Software PAST3 (Hammer et al., 2001) was used for the descriptive statistics and principal component analyses (PCA).
Results
Comparison of agronomic traits among three legumes
Distributions of agronomic traits of the three legumes are described in Table 1 and Supplementary Table 1. The average time (days) needed to initiate 50% flowering (FD) was 72.9 (range, 60 to 82) days for adzuki bean (AB), 37.6 (range, 28 to 63) days for common bean (CB), and 62.5 (range, 41 to 77) days for soybean (SB). Average time (days) to maturity (MD) was 51.4 (range, 37 to 73) days for AB, 40.7 (range, 17 to 55) days for CB, and 76.1 (range, 51 to 89) days for SB. Average growth days (GD) of AB, CB, and SB were 124.3 (range, 108 to 149), 78.3 (range, 67 to 87), and 138.6 (range, 92 to 154) days, respectively. The average value of 100-seed weight (100-SW) was 14.2 g (range, 6.9 to 21.3 g) for AB, 33.4 g (range, 12 to 54 g) for CB, and 25.8 g (range, 10 to 40 g) for SB. Among these four agro-nomic traits, 100-SW showed the highest coefficient of variation (CV) (24.1% for AB, 26.8% for CB, and 32.2% for SB). FD, MD, and GD of CB were the shortest. AB had shorter MD and GD but longer FD than SB. For 100-SW, CB had the largest value, followed by SB and AB.
Comparison of antioxidant activities and total polyphenol content among three legumes
Results of antioxidant activities and total polyphenol content among the three legumes are described in Table 1 and Supplementary Table 1. Average DPPH assay results for AB, CB, and SB were 0.056 (range, 0.012 to 0.083), 0.012 (range, 0.002 to 0.016), and 0.011 (range, 0.003 to 0.016), respectively. Average ABTS assay results for AB, CB, and SB were 2.36 (range, 0.7 to 5.3), 1.19 (range, 0.28 to 1.49), and 1.23 (range, 0.28 to 1.71) ㎎AAE/g, respectively. FRAP values of AB, CB, and SB were 2.22 (range, 0.2 to 5.4), 1.57 (range, 0.32 to 2.76), and 1.52 (range, 0.48 to 3.74) ㎎AAE/g, respectively. Total polyphenol content (TPC) in AB, CB, and SB were 4.2 (range, 1.1 to 11.7), 1.43 (range, 0.55 to 2.23), and 2.43 (range, 1.16 to 4.41) ㎎GAE/g, respectively. Based on results of these three assays, AB showed the highest antioxidant activities while CB and SB did not show significant difference. Regarding TPC, AB had the highest content, follow by SB and CB.
Correlation among agronomic traits, antioxidant activities, and total polyphenol contents of three legumes
Correlations among agricultural traits, antioxidant activities, and total polyphenol contents are shown in Fig. 1. For AB, there were significant negative correlations (p < 0.05) between FD and MD (r = -0.69), between FD and FRAP (r = -0.14), between GD and ABTS (r = -0.17), and between DPPH and FRAP (r = -0.24) while there were significant positive correlations (p < 0.05) between FD and GD (r = 0.21), between MD and GD (r = 0.57), between GD and 100-SW (r = 0.16), between ABTS and DPPH (r = 0.13), between ABTS and FRAP (r = 0.21), between ABTS and TPC (r = 0.22), and between FRAP and TPC (r = 0.36).
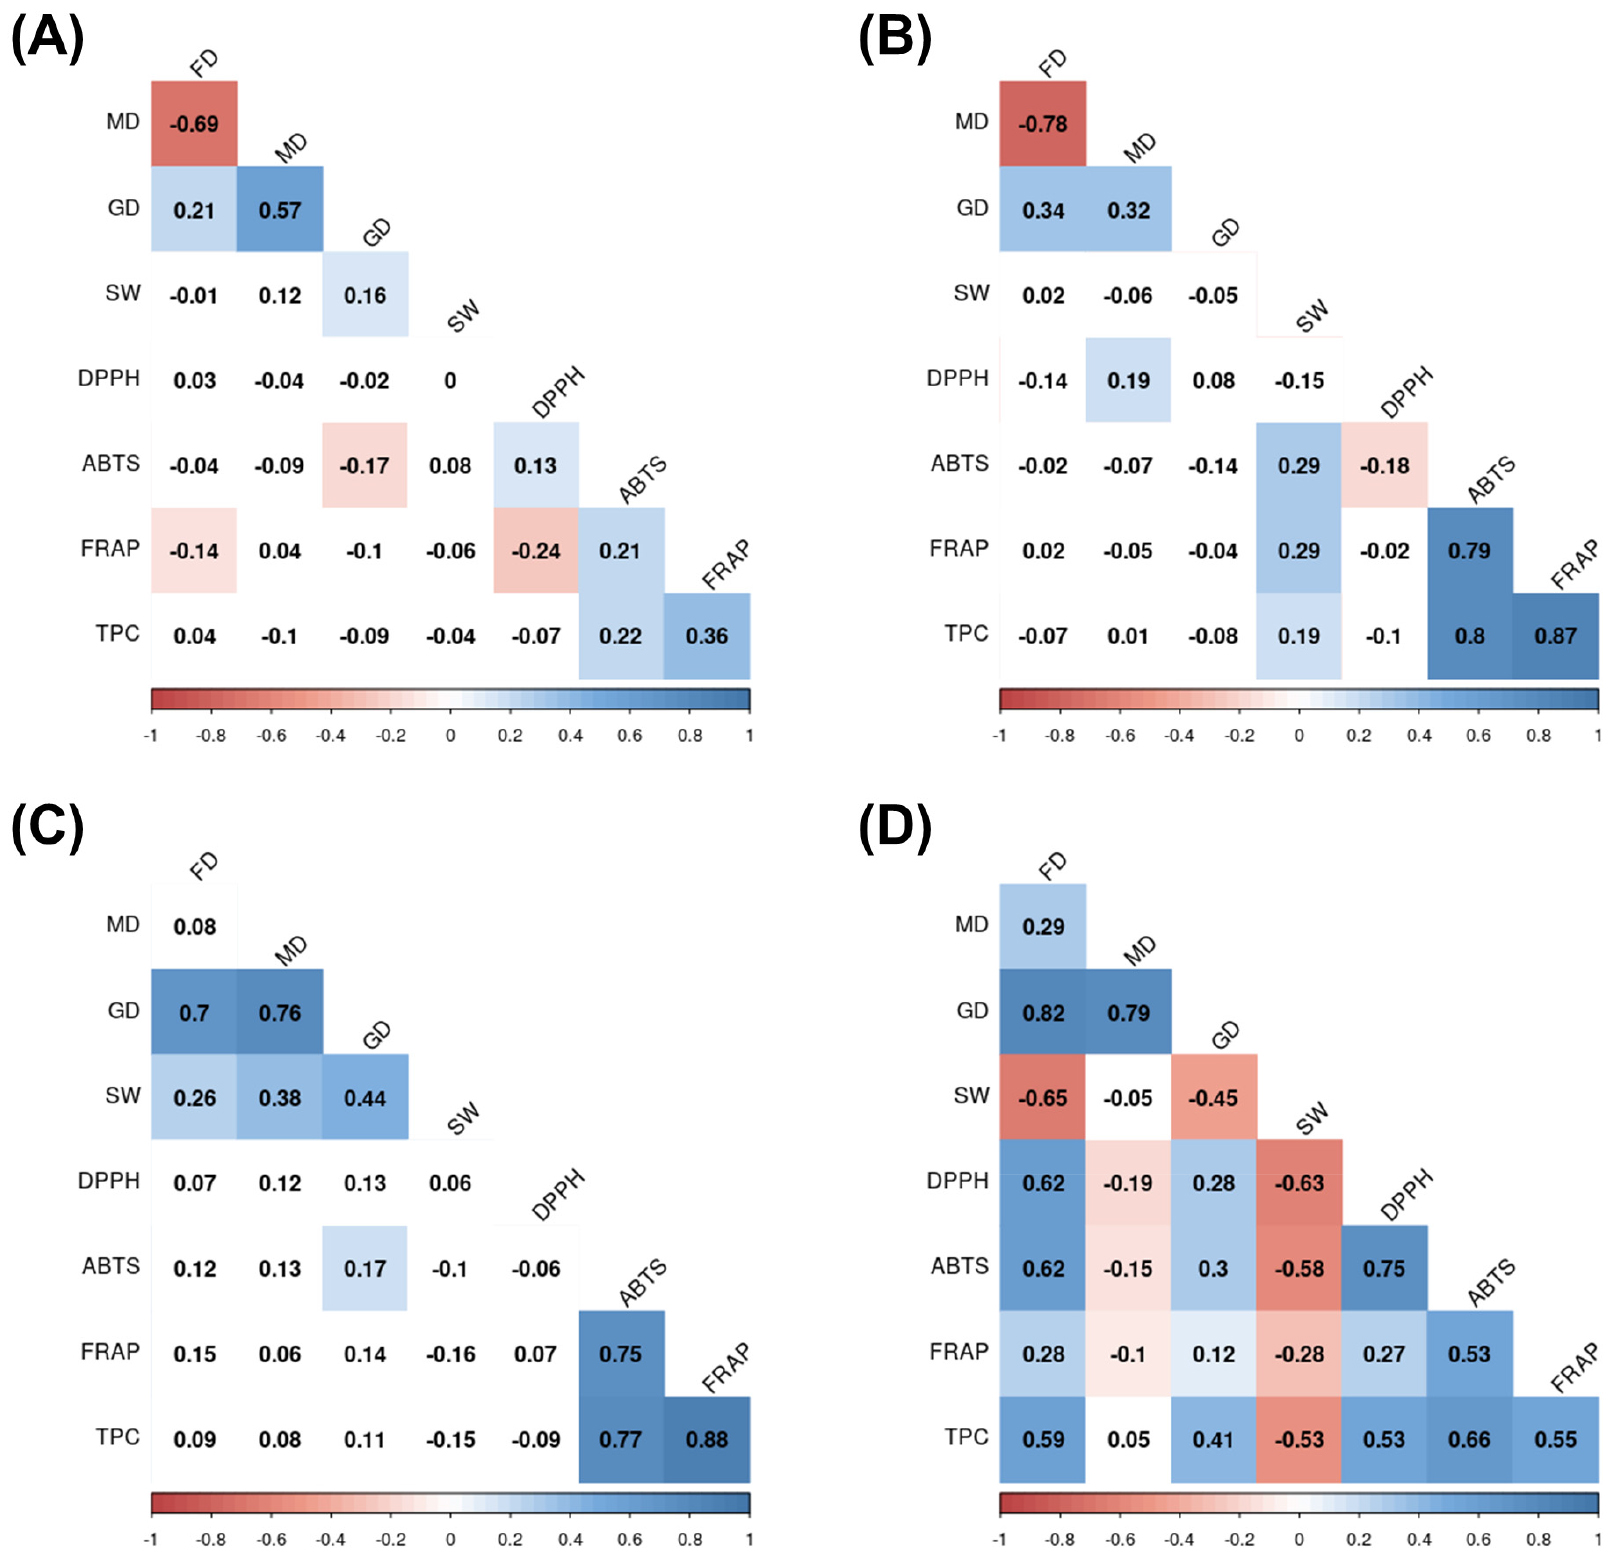
Fig. 1.
Correlations among agronomic traits, antioxidant activities, and total polyphenol contents of three legumes. (A) Correlations for adzuki bean, (B) Correlations for common bean, (C) Correlations for soybean, and (D) Correlations for all three legumes. FD, days to 50% flowering; MD, days to maturity; GD, days to growth; SW, 100-seed weight; TPC, total polyphenol contents; AB, adzuki bean; CB, common bean; SB, soybean.
For CB, there were significantly negative correlations (p < 0.05) between FD and MD (r = -0.78) and between DPPH and ABTS (r = -0.18), while there were significant positive correlations (p < 0.05) between FD and GD (r = 0.34), between MD and GD (r = 0.32), between MD and DPPH (r = 0.19), between 100-SW and ABTS (r = 0.29), between 100-SW and FRAP (r = 0.029), between 100-SW and TPC (r = 0.19), between ABTS and FRAP (r = 0.79), be-tween ABTS and TPC (r = 0.80), and between FRAP and TPC (r = 0.87).
For SB, there were significant positive correlations (p < 0.05) between FD and GD (r = 0.70), between FD and 100-SW (r = 0.26), between MD and GD (r = 0.76), between MD and 100-SW (r = 0.38), between GD and 100-SW (r = 0.44), between GD and ABTS (r = 0.17), between ABTS and FRAP (r = 0.75), between ABTS and TPC (r = 0.77), and between FRAP and TPC (r = 0.88). For all three legumes, there were significantly negative correlations (p < 0.05) between FD and 100-SW (r = -0.65), between MD and DPPH (r = -0.19), between MD and ABTS (r = -0.15), between MD and FRAP (r = -0.10), between GD and 100-SW (r = -0.45), between 100-SW and DPPH (r = -0.63), between 100-SW and ABTS (r = -0.58), between 100-SW and FRAP (r = -0.28), and between 100-SW and TPC (r = -0.53), while there were significant positive correlations between FD and MD (r = 0.29), between FD and GD (r = 0.82), between FD and DPPH (r = 0.62), between FD and ABTS (r = 0.62), between FD and FRAP (r = 0.28), between FD and TPC (r = 0.59), between MD and GD (r = 0.79), between GD and DPPH (r = 0.28), between GD and ABTS (r = 0.30), between GD and FRAP (r = 0.12), between GD and TPC (r = 0.41), between DPPH and ABTS (r = 0.76), between DPPH and FRAP (r = 0.27), between DPPH and TPC (r = 0.53), between ABTS and FRAP (r = 0.53), between ABTS and TPC (r = 0.66), and between FRAP and TPC (r = 0.55).
Principal component analysis
Principal component analysis (PCA) results using agronomic traits, antioxidant activities, and total polyphenol contents of three legumes indicated that two principal components (PCs) with eigen value > 1 could explain 74.3% of the total variance (Table 2). The first PC with an eigen value of 4.089 explained 51.1% of the total variance. FD was the variable had the largest positive loading, followed by ABTS and TPC. The second PC with an eigen value of 1.853 explained an additional 23.2% of the total variance. MD was the variable with the largest positive loading, followed by GD.
Table 2.
Principal component analysis of agronomic traits, antioxidant activities, and total polyphenol contents of three legumes, eigen values, and percentage variability explained by the first two components
| PC 1 | PC 2 | |
| Eigen value | 4.089 | 1.853 |
| % variance | 51.1 | 23.2 |
| Cumulative variability | 51.1 | 74.3 |
| FDz | 0.436 | 0.196 |
| MDz | 0.088 | 0.683 |
| GDz | 0.333 | 0.538 |
| SWz | -0.388 | 0.037 |
| DPPH | 0.383 | -0.237 |
| ABTS | 0.412 | -0.265 |
| FRAP | 0.26 | -0.259 |
| TPCz | 0.396 | -0.107 |
The first two PCs are plotted in Fig. 2. The plot of the PCA highlighted crucial information on agronomical traits, antioxidant activities, and total polyphenol contents (TPCs) in relation to legume species. The positive side of PC1 in the upper and lower right quad-rant (B and C) included growth habit (FD, MD, and GD), antioxidant activities and TPC, respectively, while the negative of PC1 in the lower left quadrant (D) contained 100-seed weight (SW) only. For adzuki bean, most of them showed the highest antioxidant activities and TPC. They are located in the lower right quadrant (C). Common beans were located in the lower left quadrant (D), showing larger 100-SW. Soybeans were distributed over A and C. They showed longer MD.
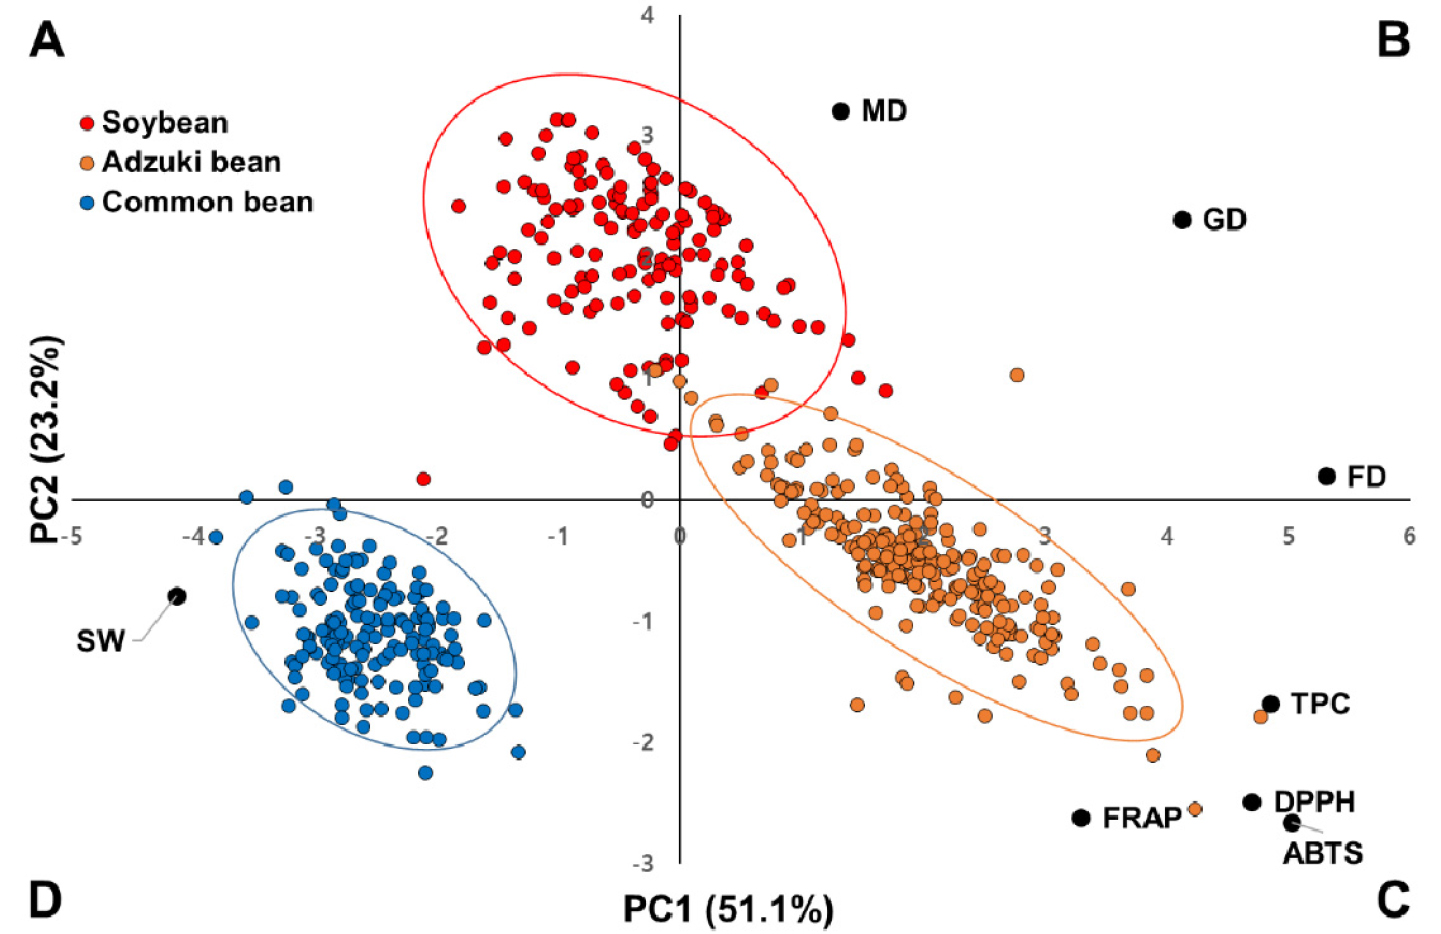
Fig. 2.
Principal component analysis based on agronomic traits, antioxidant activities, and total polyphenol contents averaged over all environments. Scatterplot showing three legume species sorted into soybean (red), adzuki bean (orange), and common bean (blue) calculated for agronomic traits according to the first two principal components. FD, days to 50% flowering; MD, days to maturity; GD, days to growth; SW, 100-seed weight; TPC, total polyphenol contents.
Hierarchical clustering analysis
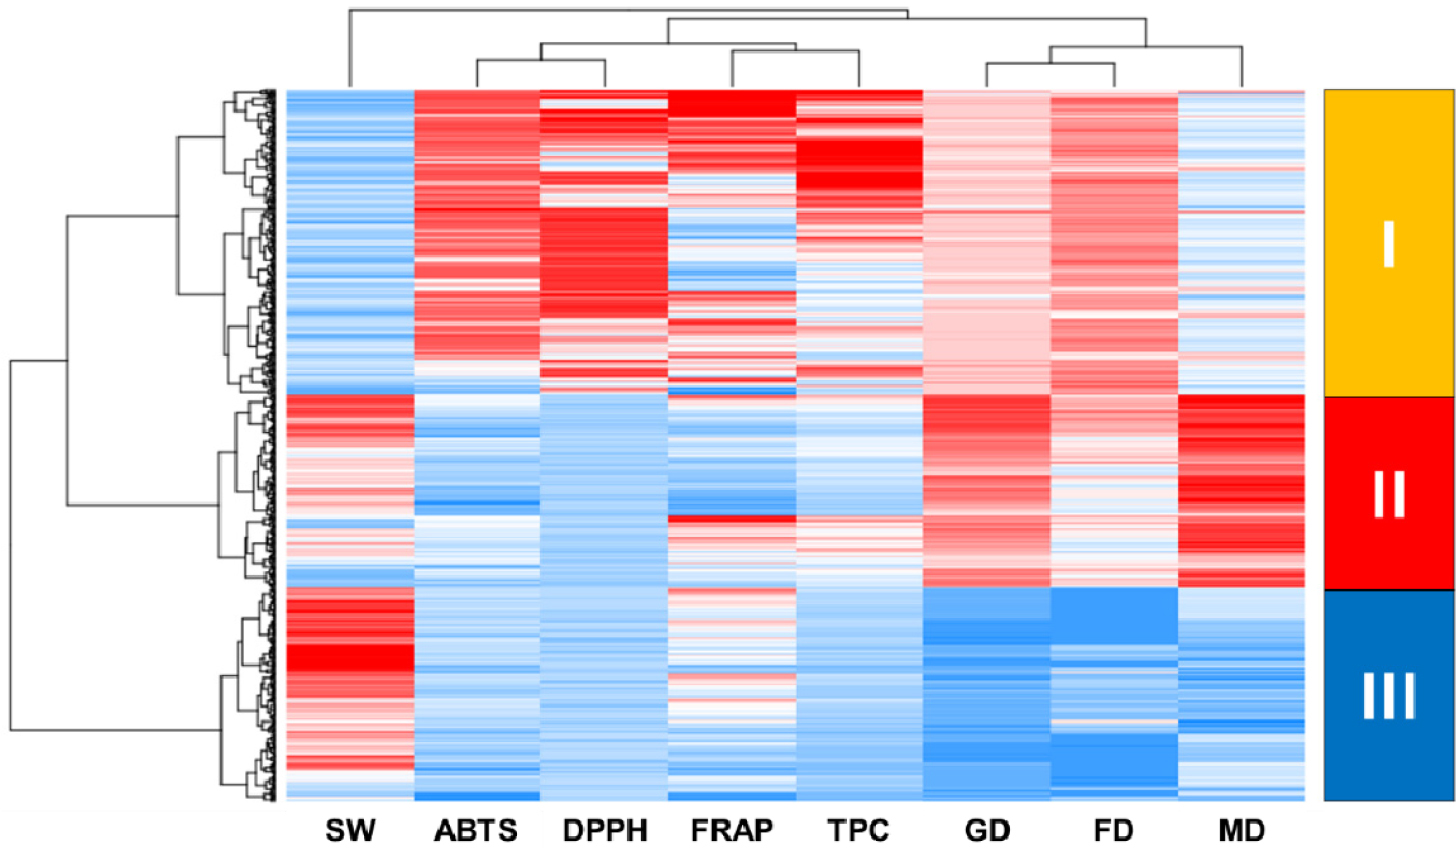
Results obtained from hierarchical cluster analysis using the Ward’s method be-tween groups are shown in Fig. 3. Three legume species were classified into three clusters according to their agronomic traits, antioxidant activities, and total polyphenol contents. Cluster I contained all 229 adzuki beans. Cluster II was made up of all 144 soybeans and one adzuki bean (IT142619). Cluster III consisted of 159 common beans and one soybean (IT274953).
Discussion
Legumes contains various bioactivity substances and phenolic compounds such as flavonoids and phenolic acids that particularly show antioxidant activities known to very important from nutritional points of views (Amarowicz and Pegg, 2008). In this study, antioxidant activities and total polyphenol contents of three legumes (adzuki beans, common beans, and black soybeans) grown mainly in Korea were analyzed. These three legumes showed various antioxidant activities and total polyphenol content (TPC) (Table 1). Previous studies have analyzed antioxidant activities and TPC of various legumes (Amarowicz and Raab, 1997; Amarowicz et al., 2004; Berghofer et al., 2009; Cardador-Martínez et al., 2002; Xu and Chang, 2007). There were differences in TPC and antioxidant activities among previous studies. Results of the present study were also different from those of previous studies. Amarowicz and Pegg (2008) have mentioned that wide variations of TPC and antioxidant activities might depend on which sample is used and/or how it is extracted/ analyzed.
Legume seed is mainly composed of seed coat and cotyledon. The seed coat, which serve as a protector of cotyledon, contains high contents of phenolic compound, while main components of cotyledon are protein and carbohydrates (Dueñas et al., 2006). In general, seed coat contains various phenolic acids, flavonoids, and condensed tannins, although seed coat of a legume has different compositions from plant to plant (Choi et al., 2020; Singh et al., 2017). Singh et al. (2017) have summarized antioxidant activities of various legumes analyzed by previous studies. Although it is impossible to directly compare antioxidant activities because of different extraction methods and samples used in each study, adzuki bean (1.76 umol Trolox/㎎) showed higher antioxidant activities than black soybeans (131.3 umol Troxox/g) and common beans (13.30 to 92.73 umol TE/g). The present study also revealed that adzuki beans showed higher antioxidant activities than the other two legumes. In addition, TPCs of adzuki beans (~ 4.15 ㎎GAE/g) were higher than those of black soybeans (2.43 ㎎GAE/g) and common beans (1.43 ㎎GAE/g) (Table 1). Dudonné et al. (2009) have analyzed correlations between antioxidant capacity and TPC using 30 plant extracts and found that the two showed a significant relationship in that phenolic compounds are major contributors to the antioxidant property. In the present study, antioxidant activities showed positive correlations with TPC, although DPPH did not show a significant correlation with TPC for any legume (Fig. 1). However, TPC and antioxidant activities overall showed positive correlations (Fig. 1D). Effect of TPC on antioxidant activities might be due to structures of phenolics known to have one or more aromatic rings with one or more hydroxyl groups. Thus, phenolics could potentially eliminate free radicals by forming resonance-stabilized phenoxyl radicals (Bors and Michel, 2002; Rice-Evans et al., 1996).
There were various correlations among agronomic traits, antioxidant activities, and TPC depending on the legume species (Figs. 1A ~ C). As a result of integrating the three legumes, 100-seed weight (100-SW) of agronomic traits showed negative correlations with antioxidant activity and TPC (Fig. 1D). Legume is generally composed of 7% to 10% of seed coat, 85% or more of cotyledon, and 2 to 3% of embryo (Ariza-Nieto et al., 2007). The size of the seed is more various than the thickness of the seed coat. Smaller legumes tend to have higher percentages of seed coat than legumes with larger cotyledonary tissues (Blair et al., 2013). As mentioned above, the higher the percentage of seed coat, the higher the antioxidant activity because seed coat contains a variety of phenolic compounds. Although the antioxidant activity may differ due to different compositions of phenolic compounds in each legume, results of this study showed a trend of difference in antioxidant activity (AB > SB > CB) depending on seed size (AB < SB < CB). Furthermore, it confirmed that seed size and antioxidant activity had a negative correlation.
In summary, antioxidant activities and TPC of three legumes (adzuki beans, common beans, and soybeans) commonly consumed in Korea were evaluated. Each legume accession showed various distributions of antioxidant activities and TPC. Among the three legumes, adzuki beans had the highest while common beans had the lowest antioxidant activities and TPC. In addition, the relationship between seed size and antioxidant activity was confirmed. Although seed compositions of the three legumes are different and differently utilized at Korea, results of this study will help us understand overall antioxidant activities of the three legumes. They provide basic information for developing functional materials using each legume. Further studies are needed to secure information for the development of breeding and/or functional materials through the analysis of phytochemicals and/or genetic diversity in order to know detailed characteristics of three legumes.
