

Introduction
Materials and Methods
Plant materials
Growth conditions
Morphological measurements
Measurement of qualitative parameters
Chlorophyll fluorescence
Statistical analysis
Results
Changes in plant growth parameters
Changes in biomass
Changes in plant quality and qualitative parameters
Changes in photochemical efficiency
Multivariate structure across photoperiods
Discussion
Introduction
Photoperiods are fundamental environmental cues that regulate plant growth and development and are known to strongly influence generation time (often shortening it), flowering time control, and morpho-physiological traits (Choi et al., 2024; Im et al., 2021; Oh et al., 2015). In controlled environments, photoperiod, light quality, and light intensity are the key independently adjustable variables of the light environment (Gim et al., 2024; Lee, 2023).
The regulation of photoperiod or daylength during the vegetative stage induces several physiological and morphological responses, such as stem elongation, shoot proliferation or branch formation, leaf area expansion, resource allocation, chlorophyll accumulation, and enhanced light-use efficiency, thereby serving as a major means of improving production efficiency and plant quality (Elkins and van Iersel, 2020; Heins and Wilkins, 1979; Hwang et al., 2025; Jackson, 2009). Within controlled environments, identifying species-specific sensitivity to photoperiod and establishing an optimum operational range are important from a productivity perspective (Marie et al., 2024; Palmer and van Iersel, 2020).
Crassulaceae, a family within Saxifragales, consists largely of succulents and comprises approximately 34 genera and 1,410 species (Messerschmid et al., 2020). Crassulaceae species are adapted to arid environments, and Crassulacean acid metabolism (CAM) is a known adaptation to these conditions (Cabahug et al., 2018). In CAM, carbon dioxide (CO2) is fixed at night and decarboxylated or re-assimilated during the day (Cushman, 2001). The genus Phedimus includes herbaceous succulents that are native to Korea and occur across diverse topographies, including lowland, montane, and insular areas (Cho et al., 2024; Lee, 2023; Lee et al., 2021; Nah et al., 2025). Ecologically, these species tend to occupy dry habitats and have low water requirements (Lee et al., 2021).
In traditional medicine in Korea and China, Phedimus species have long been used as medicinal plants (Nah et al., 2025; Wang et al., 2024a) and have been reported to exhibit antioxidant (Thuong et al., 2007), anti-inflammatory (Kim et al., 2004), antibacterial and anti-aging (Kim and Kim, 2023), and hemostatic (Lin et al., 2014) effects. In addition, owing to their CAM-based drought resistance and low maintenance requirements, Phedimus species are used in green-roof systems and rock gardens and are thus recognized as a useful group in the ornamental horticulture industry (Johnson et al., 2023; Lee et al., 2021; Sherk et al., 2020).
Despite the horticultural utility of Phedimus species, studies on their physiology are limited. Accordingly, research on the physiological responses to light and other basic environmental factors is needed. As species within this genus differ substantially in their distribution and habitat conditions (Nah et al., 2025), they may exhibit species-specific responses to photoperiodic changes. Therefore, it is necessary to quantify species-specific photoperiod sensitivity under controlled environmental conditions.
Chlorophyll fluorescence is a non-invasive analytical technique used to assess plant physiological status and photochemical efficiency (Jang et al., 2023). OJIP analysis (also known as the JIP-test) has been widely used to rapidly and effectively reveal the functional architecture of energy conversion in photosystem II (PSII) (Stirbet and Govindjee, 2011). Several parameters reflect changes in the PSII state triggered by environmental signals, including the maximum quantum yield (Fv/Fm; ΦPo), quantum yield of non-photochemical energy dissipation (ΦDo), specific energy fluxes per reaction center (e.g., ABS/RC and DIo/RC), and the performance index on an absorption basis (PIABS) (Kim et al., 2024a; Lee et al., 2024a, 2025). As noted above, photoperiod manipulation can directly influence the leaf developmental stage, chlorophyll accumulation, and biomass production. Therefore, an integrated interpretation that combines morphological traits, biomass components, plant quality indices, qualitative parameters, and chlorophyll fluorescence parameters offers a rigorous approach for evaluating and optimizing controlled light environments (Park et al., 2024; Shin et al., 2024).
Previous studies have primarily evaluated the role of photoperiod in flowering induction and dormancy physiology (Heide, 2001; Song et al., 2013); in contrast, relatively few studies have focused on vegetative growth and chlorophyll fluorescence changes in herbaceous succulent species. With respect to native Korean species of Phedimus, an experimental approach is needed that uses a cross-species comparative design simultaneously measuring morpho-physiological traits, with the aim of determining an optimal photoperiod range.
Accordingly, in this study, we established shorter (8 and 10 h·d-1), intermediate (12 h·d-1), and longer (14 h·d-1) photoperiods under controlled-environment conditions and quantified the vegetative growth responses and chlorophyll fluorescence changes in three Phedimus species native to Korea. We analyzed the correlations between morphological and physiological parameters to provide a reference for promoting vegetative growth and photochemical efficiency through species-specific photoperiod optimization.
Materials and Methods
Plant materials
To examine the effects of photoperiod on the morpho- physiological traits of native Korean Phedimus species, three species—P. latiovalifolium (IT317342), P. takesimensis (IT345944), and P. zokuriensis (IT317349)—were used as experimental plant materials. Uniform plants were obtained using stem cuttings. At the start of the experiment, the initial size of the shoots was approximately 5 ㎝ in length and 3 ㎝ in width.
Growth conditions
The experiment was conducted for 10 weeks in four growth chambers (KGC-175VH, KOENCON, Korea) installed in an experimental greenhouse at the Department of Environmental Horticulture, Sahmyook University, Nowon-gu, Seoul, Korea. Photoperiods (day/night) were set to 8/16, 10/14, 12/12, and 14/10 h·d-1, constituting four treatments. Day/night air temperatures were maintained at 26/24℃. The artificial lighting system consisted of light-emitting diodes arranged in a red:blue:white:far-red light ratio of 4:2:8:2. The photosynthetic photon flux density inside the growth chamber was adjusted to ≈500 μmol·m-2·s-1 at canopy height using a handheld spectroradiometer (SpectraPen mini, Photon Systems Instruments, Czech Republic). A fertilized horticultural substrate (Hanareumsangto; Shinsung Mineral, Korea) was used as the culture medium, and the plants were transplanted into rectangular pots (48.5 × 33.0 × 8.0 ㎝; L × W × H). Irrigation with 1.5 L of purified water was supplied twice weekly.
Morphological measurements
To assess the changes in vegetative growth, plant quality indices, qualitative parameters, and photochemical efficiency under different photoperiods, the following parameters were measured: shoot length, shoot width, ground cover, stem diameter, root length, number of branches, leaf length, leaf width, leaf area, fresh weight (FW) of shoots and roots, and dry weight (DW) of shoots and roots. The shoots were aligned against a straight edge to eliminate curvature and avoid tensile forces, and the length was recorded from the stem base to the apical tip. Shoot width was measured at the widest lateral extent when viewed from the side. The length of the longest root was determined. FW was measured after rinsing the roots with running water and air-drying them in an enclosed space for 12 h. The DW was measured after drying the samples in a heat-dry oven (HK-DO135F, HANKUK S&I, Korea) at 85℃ for 12 h. The total relative moisture content (TMC) was calculated from the FW and DW of each plant.
The plant quality indices—TMC (Lee and Nam, 2024), S/R ratio (Ko et al., 2017), compactness (Bae et al., 2025), and Dickson quality index (DQI; Dickson et al., 1960)—were computed using Equations (1), (2), (3), and (4), respectively.
(FW: fresh weight; DW: dry weight; SDW: shoot dry weight; RDW: root dry weight; SL: shoot length; TDW: total dry weight; SD: stem diameter)
Measurement of qualitative parameters
To evaluate the qualitative aspects of the plants, the color space coordinates in the CIELAB system (L*, a*, and b*) were measured. CIELAB values were obtained using a spectrophotometer (CM-2600d, Konica Minolta, Japan) set to CIELAB D65/10° by measuring the adaxial (upper) surface of the leaves. Measurements were obtained in the specular-component included mode, yielding L*, a*, and b* values. The chlorophyll content (SPAD units) was measured using a portable chlorophyll meter (SPAD-502Plus, Konica Minolta, Japan).
Chlorophyll fluorescence
To assess the physiological status and photochemical efficiency, five chlorophyll fluorescence parameters—Fv/Fm, ΦDo, ABS/RC, DIo/RC, and PIABS—were determined, as defined in Equations (5), (6), (7), (8), and (9), respectively (PSI, 2025; Stirbet and Govindjee, 2011). Chlorophyll fluorescence was recorded using a fluorometer (FluorPen FP 110/D; Photon Systems Instruments, Czech Republic). Prior to measurement, the leaves were dark-adapted for 15 min using a dark- adaptation leaf clip, in accordance with the manufacturer’s guidelines (PSI, 2025). Following the procedure described by Shin et al. (2024), the fluorometer was configured with an excitation wavelength of 455 ㎚; to induce maximal fluorescence (Fm) during the JIP-test, a super-pulse at 1,500 µmol· m-2·s-1 (50% of the instrument maximum of 3,000 µmol· m-2·s-1) was used.
Statistical analysis
The study was conducted using a completely randomized design in four growth chambers, each assigned to one of the four photoperiod treatments. Within each chamber, individual plants were randomly arranged on benches, and each plant was treated as a single experimental unit. For each species, 10 plants were allocated to each photoperiod treatment (n = 10), resulting in 40 plants per species and 120 plants in total. Statistical analyses were performed using SAS 9.4 (SAS Institute, USA). A two-way analysis of variance (ANOVA) was conducted with species and photoperiod as fixed factors. Post-hoc mean separation among the photoperiod treatments within each species was performed using Duncan’s multiple range test (DMRT) at p &5.
Principal component analysis (PCA) was performed on the correlation matrix after z-score standardization of all variables. Principal components were extracted by eigen decomposition, and loadings were computed as eigenvectors scaled by the √eigenvalue; no rotation was applied. The results are presented as a PC1–PC2 loading plot with a correlation (unit) circle overlaid and the axes annotated with the percentage of explained variance.
Pearson correlation coefficients (r) were calculated to examine the relationships between the key parameters and indices. The correlation results are visualized as a heatmap using a red (+) / blue (-) color scale.
Results
Changes in plant growth parameters
The shoot length of P. takesimensis was greatest under a 14-h (h·d-1) photoperiod, reaching 23.78 ㎝ (Fig. 1 and Table 1). With respect to shoot width, maximum values were obtained for P. latiovalifolium (4.82 to 5.05 ㎝) and P. zokuriensis (5.85 ㎝) under a photoperiod of 12–14 h·d-1. In all three species, stem diameter was greatest under the longest photoperiod (14 h·d-1): P. latiovalifolium (0.22 ㎝), P. takesimensis (0.40 ㎝), and P. zokuriensis (0.21 ㎝). In two of the three species, P. latiovalifolium and P. takesimensis, root length did not differ significantly among the treatments, in contrast with P. zokuriensis, in which root length was longest under the shortest photoperiod (8 h·d-1; 8.51 ㎝).

Fig. 1.
Representative photographs of three Korean native Phedimus species grown under four photoperiod regimes for 10 weeks: A) P. latiovalifolium; B) P. takesimensis; and C) P. zokuriensis. Scale bars are 1.5, 3.0, and 2.0 ㎝ for P. latiovalifolium, P. takesimensis, and P. zokuriensis, respectively.
Table 1.
Plant and leaf sizes of three Korean native Phedimus species after 10 weeks under four different photoperiods.
| Species |
Photoperiod (h·d-1) | Plant sizes (㎝) | Number of branches | Leaf sizes (㎝) |
Leaf area (㎠) | ||||
| Shoot length | Shoot width | Stem diameter | Root length | Length | Width | ||||
| P. latiovalifolium | 8 | 4.56 az | 3.48 b | 0.16 b | 11.62 a | 1.4 a | 2.18 a | 1.88 a | 4.24 a |
| 10 | 4.86 a | 3.32 b | 0.18 ab | 10.30 a | 1.4 a | 2.30 a | 1.92 a | 4.45 a | |
| 12 | 5.00 a | 4.82 a | 0.20 ab | 10.54 a | 2.0 a | 2.58 a | 2.34 a | 6.14 a | |
| 14 | 4.97 a | 5.05 a | 0.22 a | 10.60 a | 1.7 a | 2.65 a | 1.90 a | 5.17 a | |
| P. takesimensis | 8 | 17.41 b | 9.97 a | 0.31 b | 13.86 a | 10.2 a | 3.98 a | 1.96 a | 7.95 a |
| 10 | 19.35 b | 9.93 a | 0.33 b | 15.58 a | 10.1 a | 4.52 a | 1.82 ab | 8.24 a | |
| 12 | 20.37 b | 9.73 a | 0.32 b | 12.80 a | 10.1 a | 4.52 a | 1.86 ab | 8.44 a | |
| 14 | 23.78 a | 9.88 a | 0.40 a | 11.27 a | 8.4 a | 4.51 a | 1.60 b | 7.18 a | |
| P. zokuriensis | 8 | 6.47 a | 4.83 b | 0.15 b | 8.51 a | 1.1 a | 2.91 a | 1.97 a | 5.81 a |
| 10 | 6.31 a | 4.90 b | 0.16 b | 6.06 b | 1.3 a | 2.92 a | 1.82 a | 5.37 a | |
| 12 | 6.40 a | 4.87 b | 0.16 b | 6.01 b | 1.4 a | 2.95 a | 1.79 a | 5.35 a | |
| 14 | 7.30 a | 5.85 a | 0.21 a | 6.03 b | 1.7 a | 3.06 a | 1.80 a | 5.55 a | |
| Significancey | Species (S) | *** | *** | *** | *** | *** | *** | * | *** |
| Photoperiod (P) | *** | NS | *** | NS | NS | NS | * | NS | |
| S × P | * | NS | NS | NS | NS | NS | NS | NS | |
The number of branches did not differ among treatments in any of the three Phedimus species. Similarly, leaf length showed no significant treatment effects. In contrast, in P. takesimensis, leaf width was greatest under the shortest photoperiod (1.96 ㎝) and tended to decrease under 14 h·d-1 (1.60 ㎝). The leaf area did not differ significantly among the treatments.
Changes in biomass
According to the biomass analysis, the shoot fresh weight (SFW) of P. latiovalifolium was higher under the intermediate and longer photoperiods (12–14 h·d-1), ranging from 1.41 to 2.00 g, whereas in the other two species, no significant differences among photoperiods were observed (Table 2). Root fresh weight (RFW) was greatest at 14 h·d-1 in P. latiovalifolium and P. zokuriensis (1.34 and 1.02 g, respectively). The total fresh weight (TFW) mirrored the SFW response in P. latiovalifolium, with a maximum of 3.34 g at 14 h·d-1; the lowest value occurred at 8 h·d-1 (1.00 g).
Table 2.
Biomass components and total relative moisture content of three Korean native Phedimus species after 10 weeks under four different photoperiods.
| Species |
Photoperiod (h·d-1) | Fresh weight (g) |
Total fresh weight (g) | Dry weight (g) |
Total dry weight (g) | Total relative moisture content (%) | |||
| Shoot | Root | Shoot | Root | ||||||
| P. latiovalifolium | 8 | 0.69 bz | 0.31 b | 1.00 c | 0.06 c | 0.09 a | 0.15 c | 84.6 a | |
| 10 | 0.73 b | 0.34 b | 1.08 bc | 0.07 bc | 0.10 a | 0.17 bc | 83.2 a | ||
| 12 | 1.41 a | 1.02 ab | 2.44 ab | 0.12 ab | 0.22 a | 0.34 ab | 85.6 a | ||
| 14 | 2.00 a | 1.34 a | 3.34 a | 0.17 a | 0.23 a | 0.40 a | 87.3 a | ||
| P. takesimensis | 8 | 22.81 a | 1.17 a | 25.99 a | 1.75 b | 0.26 a | 2.02 b | 92.2 a | |
| 10 | 24.94 a | 1.45 a | 26.39 a | 2.14 b | 0.31 a | 2.46 b | 90.4 b | ||
| 12 | 24.71 a | 1.42 a | 26.14 a | 2.23 b | 0.32 a | 2.56 b | 90.0 b | ||
| 14 | 32.66 a | 1.59 a | 34.26 a | 2.97 a | 0.36 a | 3.33 a | 90.1 b | ||
| P. zokuriensis | 8 | 2.15 a | 0.86 ab | 3.02 a | 0.13 b | 0.18 a | 0.32 a | 89.4 a | |
| 10 | 2.13 a | 0.80 ab | 2.93 a | 0.14 ab | 0.18 a | 0.32 a | 89.0 a | ||
| 12 | 2.13 a | 0.69 b | 2.82 a | 0.15 ab | 0.18 a | 0.34 a | 87.8 b | ||
| 14 | 2.64 a | 1.02 a | 3.67 a | 0.19 a | 0.22 a | 0.41 a | 88.3 ab | ||
| Significancey | Species (S) | *** | *** | *** | *** | *** | *** | *** | |
| Photoperiod (P) | NS | * | * | *** | * | *** | * | ||
| S × P | NS | NS | NS | ** | NS | * | ** | ||
Shoot dry weight (SDW) was maximized at 14 h·d-1 in P. latiovalifolium (0.17 g), P. takesimensis (2.97 g), and P. zokuriensis (0.19 g), and the lowest values occurred at 8 h·d-1 in P. latiovalifolium (0.06 g) and P. zokuriensis (0.13 g). In contrast, root dry weight showed no significant differences among the photoperiods in any species. The total dry weight (TDW) was highest at 14 h·d-1 in P. latiovalifolium (0.40 g) and P. takesimensis (3.33 g).
Regarding total relative moisture content (TMC), P. latiovalifolium showed no significant differences among photoperiods, whereas P. takesimensis had the highest value at 8 h·d-1 (92.2%). In P. zokuriensis, the values were relatively high under 8–10 h·d-1 (89.0–89.4%).
Changes in plant quality and qualitative parameters
Among the evaluated plant quality indices and qualitative parameters, the shoot-to-root ratio (S/R)—an index of resource allocation between shoot and root biomass—showed no significant differences among photoperiod treatments (Table 3). The plant quality index of compactness, which reflects biomass accumulation relative to shoot length, was highest in P. latiovalifolium at 14 h·d-1 (0.036), whereas the other two species showed no significant photoperiod effects. The DQI, an indicator of overall plant quality, was higher in P. latiovalifolium under 12–14 h·d-1 (0.116–0.126), and in P. zokuriensis it reached its maximum at 14 h·d-1 (0.098).
Table 3.
Plant quality indices, chlorophyll content, and CIELAB coordinates (L*, a*, and b*) of three Korean native Phedimus species after 10 weeks under four different photoperiods.
| Species |
Photoperiod (h·d-1) | Plant quality indices |
Chlorophyll content (SPAD units) | CIELAB coordinates | ||||
| S/R | Compactness | DQI | L* | a* | b* | |||
| P. latiovalifolium | 8 | 0.94 az | 0.014 b | 0.046 b | 46.56 a | 42.98 a | -8.05 ab | 21.03 a |
| 10 | 0.84 a | 0.016 b | 0.052 b | 46.45 a | 42.79 a | -8.19 ab | 21.81 a | |
| 12 | 0.65 a | 0.025 ab | 0.116 a | 48.80 a | 41.65 a | -7.74 a | 21.17 a | |
| 14 | 0.85 a | 0.036 a | 0.126 a | 40.36 b | 42.26 a | -8.42 b | 21.46 a | |
| P. takesimensis | 8 | 7.57 a | 0.107 a | 0.169 a | 51.89 a | 39.90 a | -9.06 ab | 16.86 ab |
| 10 | 7.13 a | 0.111 a | 0.194 a | 55.17 a | 38.24 a | -8.30 ab | 16.72 ab | |
| 12 | 7.29 a | 0.115 a | 0.197 a | 55.74 a | 38.03 a | -8.10 a | 16.05 b | |
| 14 | 8.39 a | 0.128 a | 0.241 a | 50.88 a | 40.37 a | -9.22 b | 19.63 a | |
| P. zokuriensis | 8 | 0.79 a | 0.021 a | 0.063 b | 43.69 a | 41.94 a | -7.49 a | 18.56 a |
| 10 | 0.77 a | 0.022 a | 0.070 ab | 38.97 b | 42.97 a | -7.34 a | 18.24 a | |
| 12 | 0.88 a | 0.024 a | 0.071 ab | 38.83 b | 40.99 ab | -6.51 a | 16.93 a | |
| 14 | 0.84 a | 0.026 a | 0.098 a | 38.07 b | 39.72 b | -7.18 a | 16.67 a | |
| Significancey | Species (S) | *** | *** | *** | *** | *** | *** | *** |
| Photoperiod (P) | NS | NS | ** | ** | NS | ** | NS | |
| S × P | NS | NS | NS | NS | NS | NS | NS | |
As for chlorophyll content, P. latiovalifolium recorded higher values under 8–12 h·d-1 (46.45–48.80 SPAD units), compared with a minimum at 14 h·d-1 (40.36 SPAD units). In contrast, P. zokuriensis showed the highest value at 8 h·d-1 (43.69 SPAD units), with relatively lower values under 10–14 h·d-1 (38.07–38.97 SPAD units).
Among the CIELAB color-space coordinates, L* (lightness) was relatively high under 8–10 h·d-1 in P. zokuriensis (41.94–42.97), whereas no significant differences were detected in the other two species. The a* coordinate (green-red opponent colors) in P. latiovalifolium and P. takesimensis was highest at 12 h·d-1 (-7.74 and -8.10, respectively). The b* coordinate (blue-yellow opponent colors) in P. takesimensis was highest under 14 h·d-1 (19.63).
Changes in photochemical efficiency
The results of the photochemical efficiency analysis based on chlorophyll fluorescence showed that the maximum quantum yield (Fv/Fm) was highest in P. takesimensis under the 14 h·d-1 photoperiod (0.840), and P. zokuriensis showed relatively high values across 10–14 h·d-1 (0.837–0.845; Fig. 2). The quantum yield of non-photochemical energy dissipation (ΦDo) reached its highest value in P. takesimensis at 10 h·d-1 (0.193), whereas in P. zokuriensis, it was higher under the 8 h·d-1 photoperiod (0.179). The absorption flux per reaction center (ABS/RC) in P. takesimensis was relatively high at 8–10 h·d-1 (1.20–1.23), and in P. zokuriensis it peaked at 8 h·d-1 (1.56). The dissipated energy flux per reaction center (DIo/RC) was highest in P. takesimensis at 10 h·d-1 (0.243), and in P. zokuriensis at 8 h·d-1 (0.283).
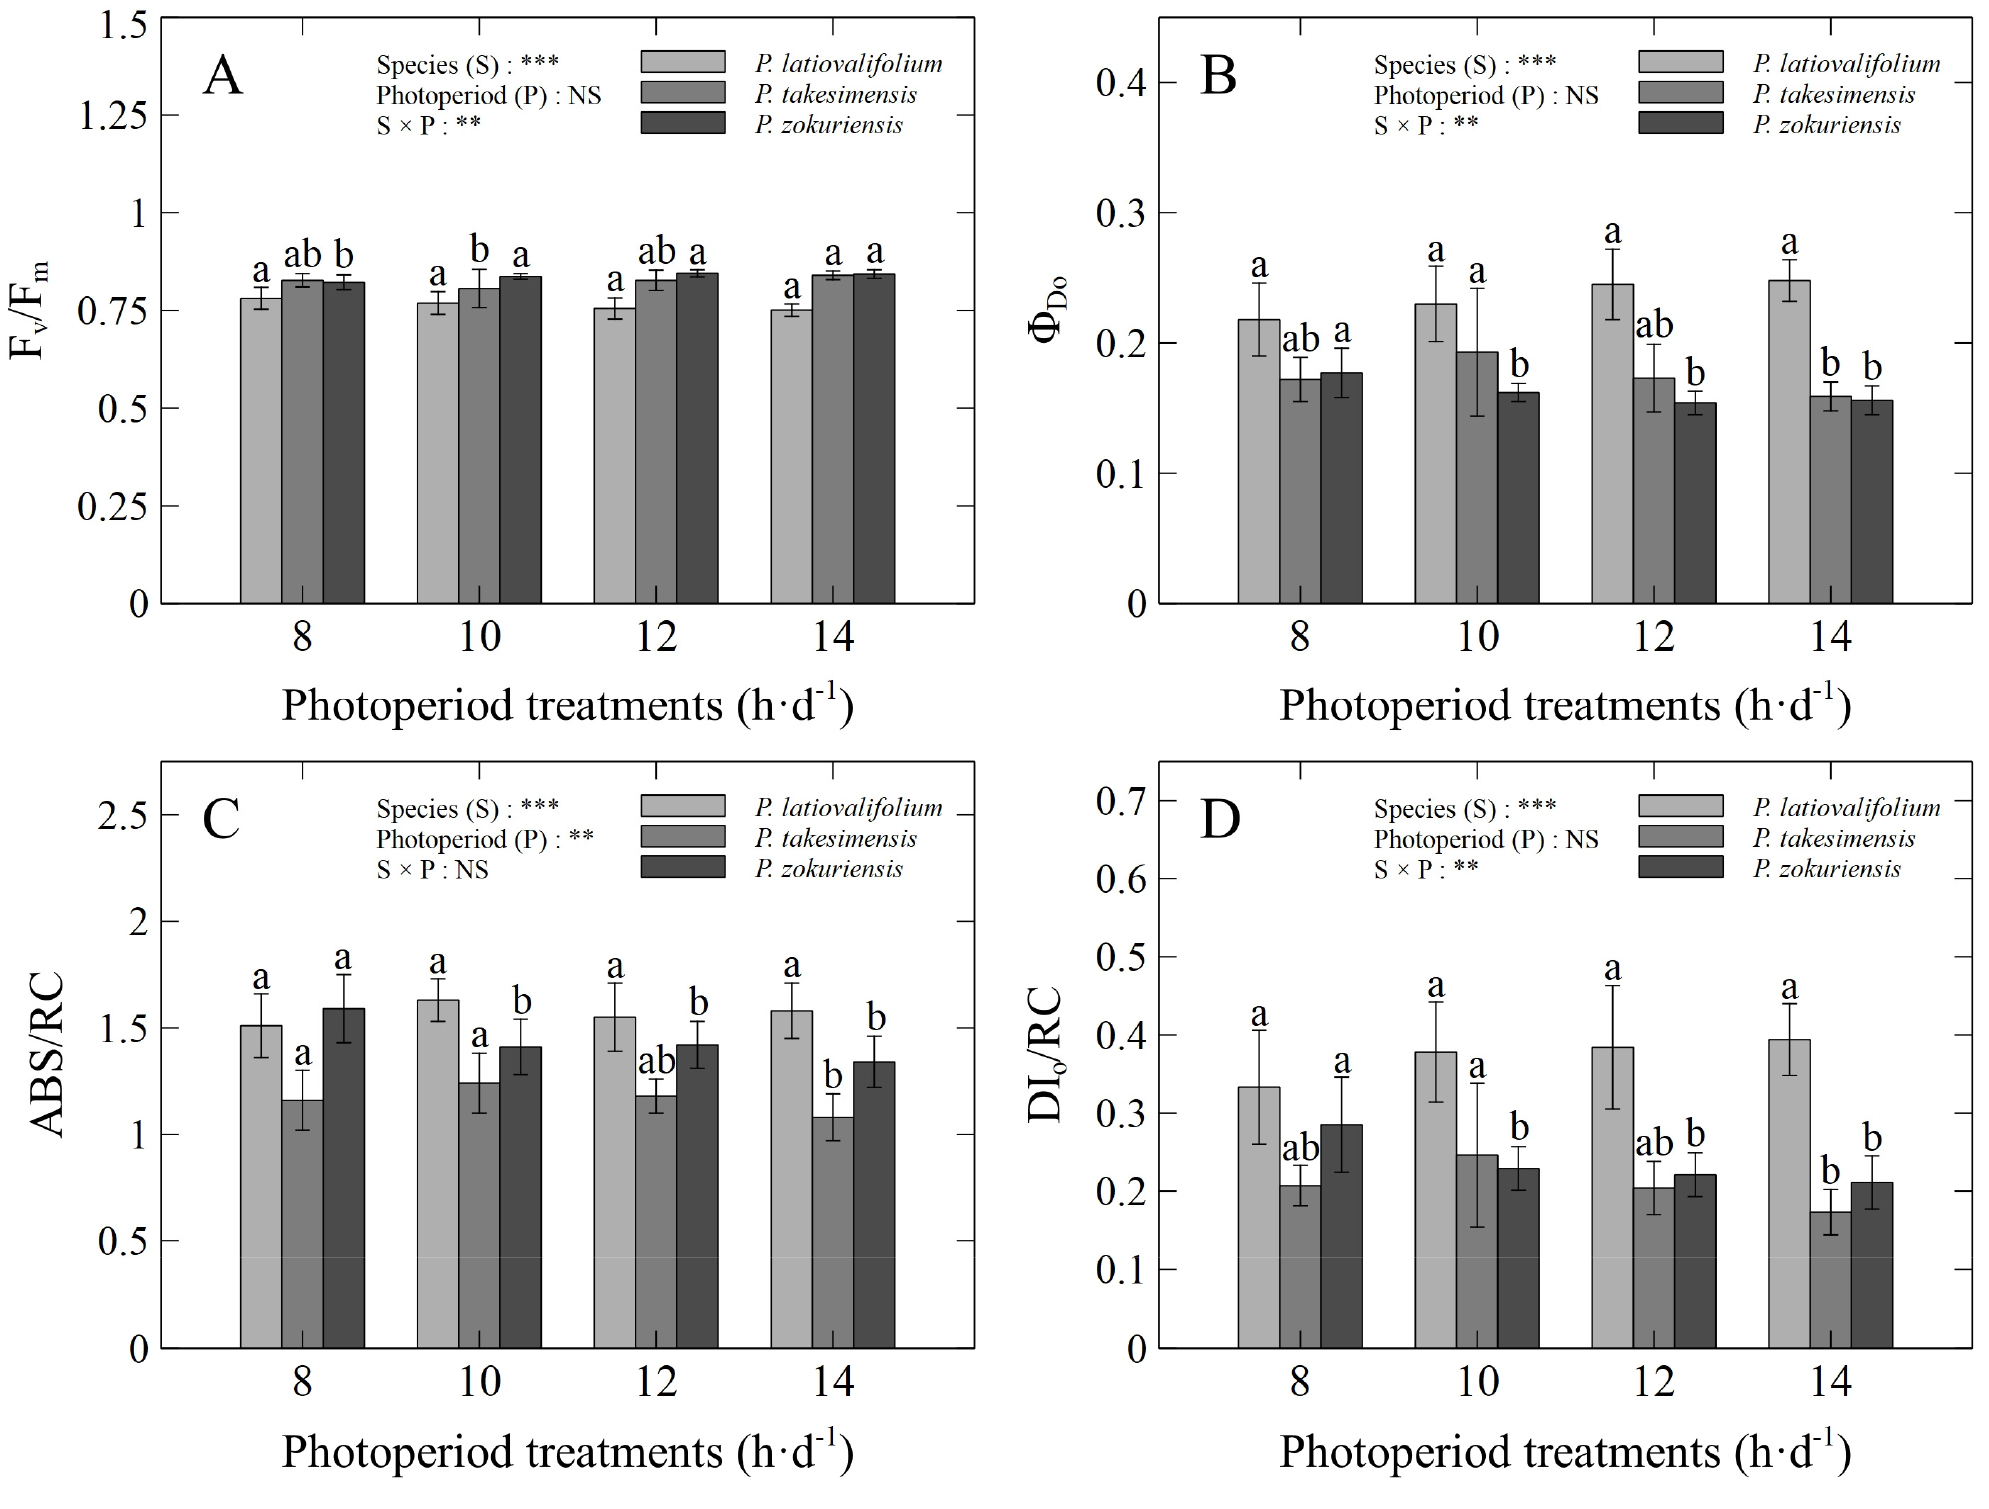
Fig. 2.
Chlorophyll fluorescence parameters of three Korean native Phedimus species after 10 weeks under four different photoperiods: A) Fv/Fm; B) ΦDo; C) ABS/RC; and D) DIo/RC. Vertical bars indicate standard deviation. Asterisks indicate significance (**: p &1; ***: p &01); NS, non-significant (p > 0.05). Means followed by different lowercase letters within each species indicate significant differences among photoperiod treatments according to Duncan’s multiple range test (DMRT) at p &5 (n = 10).
Regarding the performance index on an absorption basis (PIABS), P. latiovalifolium showed no significant differences among photoperiods (Fig. 3). In P. takesimensis, PIABS was highest under 14 h·d-1 (15.08). In P. zokuriensis, PIABS values over the 10–14 h·d-1 range (9.32–10.55) were higher than the corresponding value at 8 h·d-1 (7.21).
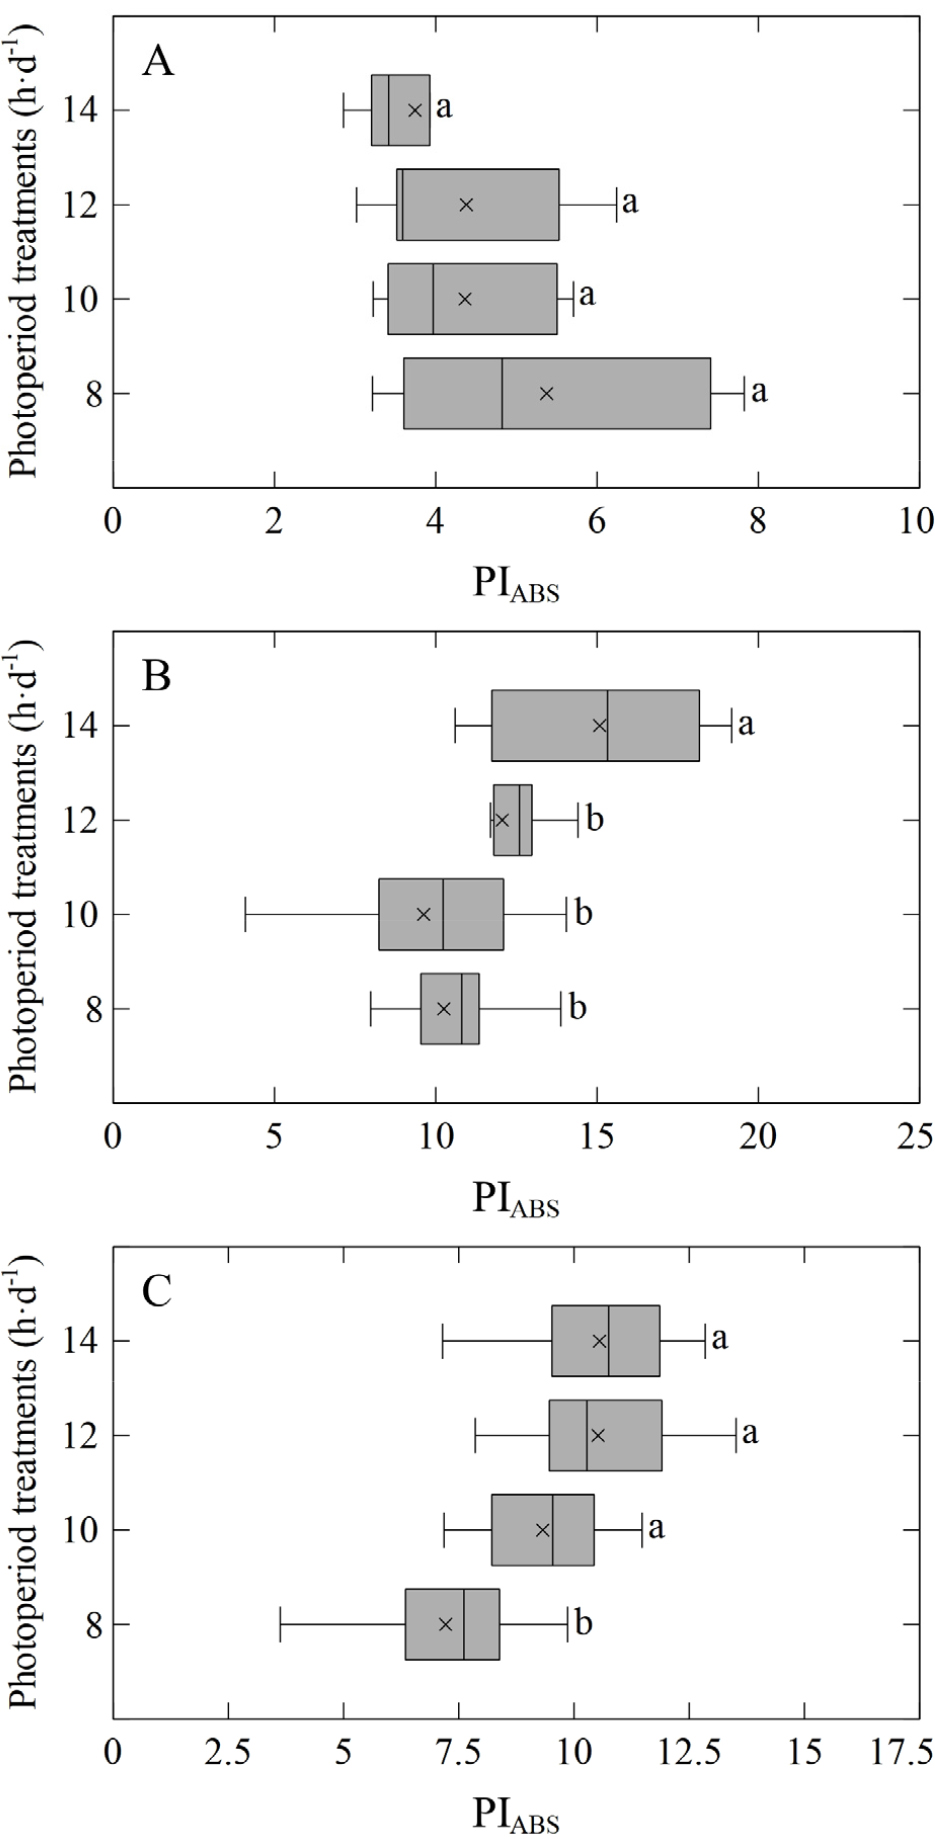
Fig. 3.
Performance index on an absorption basis (PIABS) of three Korean native Phedimus species after 10 weeks under four different photoperiods: A) P. latiovalifolium; B) P. takesimensis; and C) P. zokuriensis. In the box plots, the line within each box indicates the median (Q2), and the “×” marks the mean. The box bounds correspond to the third (Q3) and first (Q1) quartiles, and the whiskers extend to the minimum and maximum values, respectively. Means followed by different lowercase letters are significantly different based on DMRT at p &5 (n = 10).
Multivariate structure across photoperiods
The results of the PCA showed that PC1 and PC2 explained 56.0% and 18.9% of the total variance, respectively, for a cumulative explained variance of 74.9% (Fig. 4A). In PC1, shoot length, shoot width, stem diameter, leaf length, TFW, TDW, compactness, S/R ratio, DQI, and PIABS were loaded in the positive direction. In contrast, ABS/RC and DIo/RC were negatively loaded. In PC2, Fv/Fm and PIABS loaded negatively, whereas ΦDo and DIo/RC loaded positively, forming a contrast axis between reduced photochemical efficiency and increased energy dissipation. Fv/Fm and ΦDo exhibited a trade-off, implying an antagonistic relationship. Overall, the growth parameters and plant quality indices tended to be distinct from the chlorophyll fluorescence parameters in the PC1–PC2 plane.
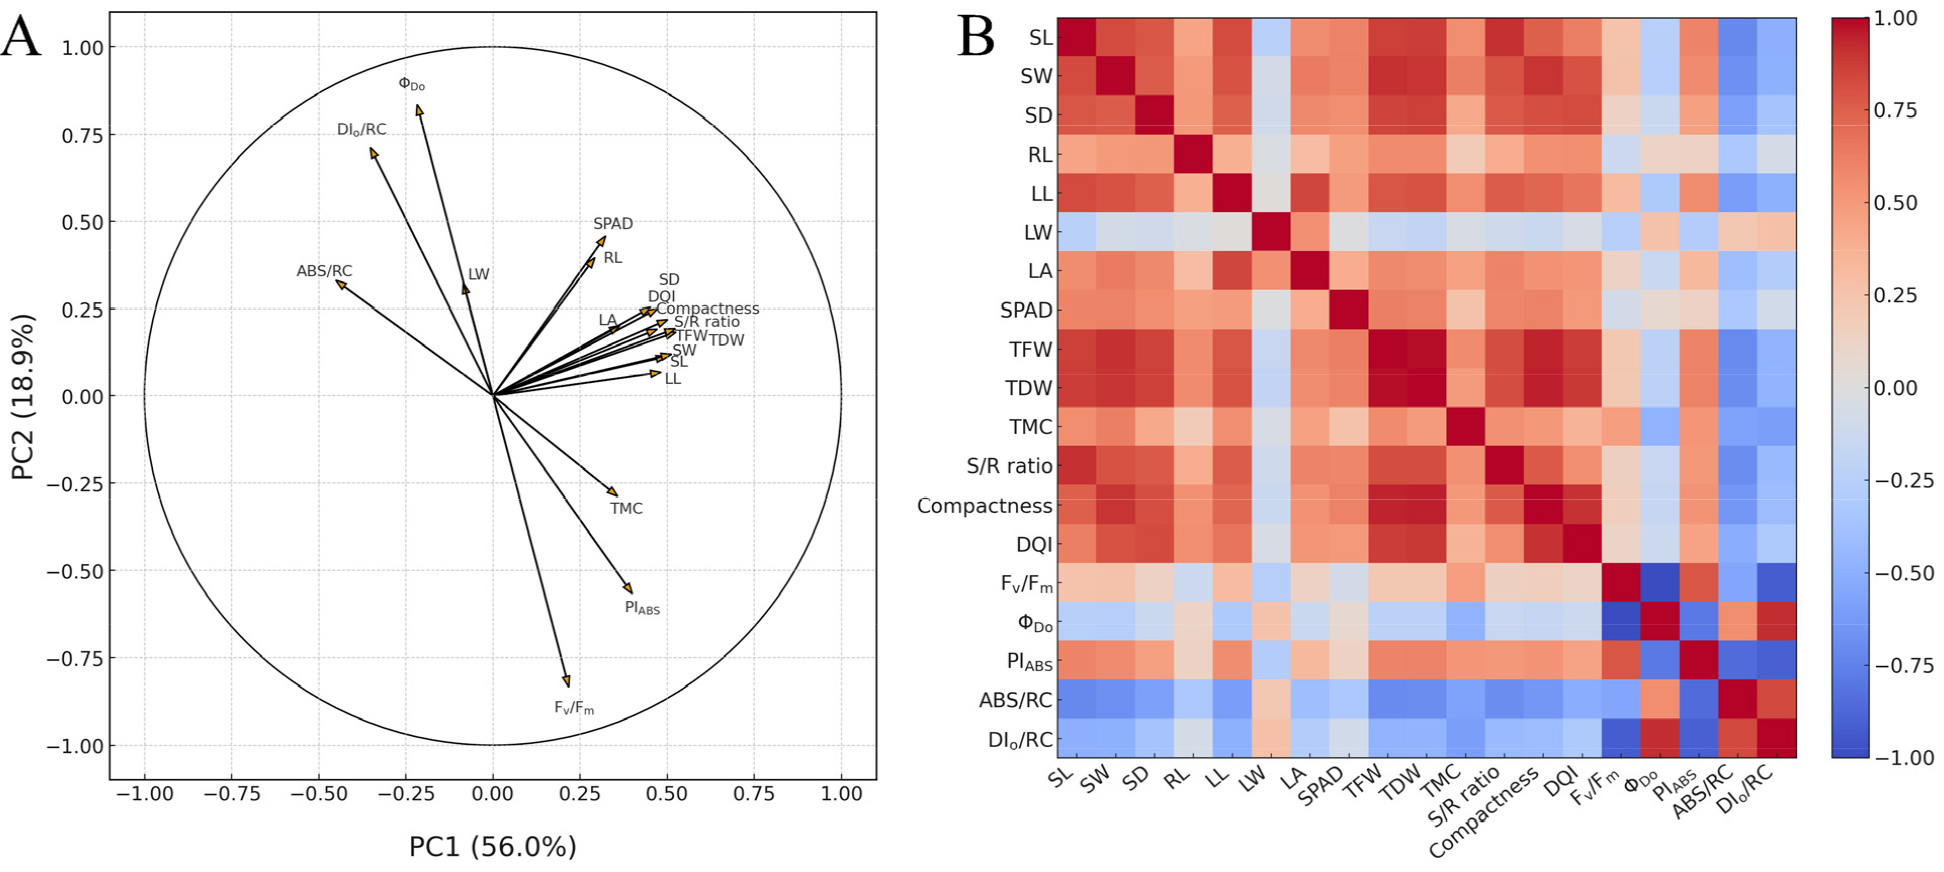
Fig. 4.
Variable association structures across photoperiods in three Korean native Phedimus species. A) Principal component analysis (PCA) of vegetative growth parameters (plant size and biomass components), plant quality indices, chlorophyll content (SPAD units), and chlorophyll fluorescence parameters; B) Pearson correlation of the same variables across photoperiod treatments. SL: shoot length; SW: shoot width; SD: stem diameter; RL: root length; LL: leaf length; LW: leaf width; LA: leaf area; TFW: total fresh weight; TDW: total dry weight; TMC: total relative moisture content; DQI: Dickson quality index.
Very strong positive Pearson correlations were observed between the growth parameters and biomass components (Fig. 4B). A strong positive correlation was observed between TFW and TDW (r = 0.980). Similarly, TDW and compactness (r = 0.947) and TFW and compactness (r = 0.943) showed strong positive associations. Several plant size-related variables, plant quality indices, and biomass components were positively correlated, notably between shoot length and S/R (r = 0.908) and between shoot width and TFW (r = 0.907), indicating that a greater plant size tends to accompany a higher biomass and a shift toward shoot-directed resource allocation.
Regarding the relationship between photochemical efficiency and stress indicators, Fv/Fm and DIo/RC exhibited a strong negative correlation (r = -0.917). PIABS, the photochemical performance index, correlated strongly and negatively with ABS/RC (r = -0.855) and DIo/RC (r = -0.906). PIABS showed a strong negative correlation with ΦDo (r = -0.786).
Discussion
Photoperiod (here approximated by daylength), like light quality, light intensity, temperature, and water availability, is a fundamental environmental cue that regulates diverse plant responses, including morphogenesis, photosynthesis, resource allocation, and dormancy (Adams and Langton, 2005; An et al., 2021; Ding et al., 2024; Xu et al., 2024). Because leaf photoreceptors differ in composition and downstream signaling, sensitivity to photoperiod can vary by species, developmental stage, and organ (Imaizumi and Kay, 2006; Watanabe et al., 2012). Therefore, this study compared and analyzed vegetative growth and photochemical efficiency in three native Korean Phedimus species under different photoperiods to elucidate the linkages between vegetative growth, plant quality, qualitative parameters, and photochemical efficiency, and to identify species-specific optimal photoperiods.
First, with respect to vegetative growth, P. takesimensis exhibited the greatest shoot length under the longest photoperiod of this study (14 h·d-1), and stem diameter was higher under long-day conditions across all three species, indicating that longer photoperiods favored shoot elongation and stem thickening. This is consistent with previous reports that long days activate the gibberellic acid (GA) pathway, promoting stem elongation (Xu et al., 1997). The response to photoperiod is mediated by phytochromes that upregulate GA biosynthetic genes (e.g., GA3ox and GA20ox), leading to the accumulation of active GA and enhanced shoot growth (Lee et al., 1998). These findings provide a mechanistic link to the study by Talon and Zeevaart (1990) in which long-day photoperiods in the long-day plant Silene armeria were shown to enhance stem elongation by increasing bioactive GA1 levels in shoot tips through modulation of GA metabolism. Our results concur with those of previous studies showing that stem diameters were greater under longer photoperiods than under shorter photoperiods (Kim et al., 2024b; Kozai et al., 1995; Wang et al., 2024b). Further studies are required to quantify active GA levels and validate the expression of related genes under contrasting photoperiods.
In contrast, in P. zokuriensis, root length was maximal under the shortest photoperiod (8 h·d-1), suggesting that a short photoperiod is advantageous for root elongation. Short- day treatments have been applied to enhance root system development and density (Fløistad and Eldhuset, 2017; Pan et al., 2017). Short-day regimes can suppress shoot elongation while directing assimilates toward the root system; thus, a shortened photoperiod increases root growth capacity and plug cohesion, thereby improving early post-transplant establishment and drought tolerance (Lamhamedi et al., 2013). Previous studies have indicated that short days can simultaneously suppress shoot growth, induce new root formation, increase root growth potential, and enhance resilience to transplant stress (Iakovoglou et al., 2012; Jiang et al., 2019). In this context, our findings are partially congruent, although the relatively narrow photoperiod range tested in this study may have limited the magnitude of these effects.
Across all species, the number of branches and leaf length did not differ among photoperiod treatments, indicating that within the tested range (8–14 h·d-1), the effects on branching or leaf elongation were relatively limited. In P. takesimensis, leaf width was greatest under the shortest photoperiod and tended to decline as photoperiod length increased. Although daylength is known to govern leaf expansion and plant size, responses can vary by species and cultivar (Cookson et al., 2007). Consistent with our observations, Kim et al. (2024b) reported that in the medicinal crop danshen (Salvia miltiorrhiza), continuous light markedly reduced both leaf length and width, whereas no differences were detected within the 8–16 h·d-1 range. Overall, this study revealed species-specific responses yielding divergent vegetative outcomes; thus, even under the same stimulus, morphological optima differed among species, underscoring the need to set photoperiods that match species-specific and organ-specific targets.
Biomass reflects the integrated outcome of photosynthetic carbon assimilation, respiratory (catabolic) losses, and resource allocation, and is a key indicator directly associated with plant productivity. Photoperiod modulates assimilate flow and hormonal output, shifting the balance between shoot and root growth (Carlen et al., 1999; Shem-Tov and Gutterman, 2003; Singh et al., 2018; Sulpice et al., 2014). In our study, P. takesimensis showed significant increases in SDW and TDW under the longest photoperiod, which was consistent with the preceding increase in the shoot length. In P. latiovalifolium and P. zokuriensis, RFW was highest under the longest photoperiod, suggesting that photoperiod extension can promote root biomass. TMC tended to be higher under the shortest photoperiod in P. takesimensis (92.2%) and under 8–10 h·d-1 in P. zokuriensis (89.0–89.4%), implying that the internal water status may be coupled to photoperiod in a species-dependent manner. On these grounds, in production and propagation systems, a phase-specific photoperiod schedule, using a shorter photoperiod in the early growth stage to promote root system development and a longer photoperiod in the mid-to-late stages to induce shoot elongation and stem thickening, may be a useful approach. The concept of varying photoperiod/daylengths across developmental stages has been discussed in previous studies (Aoki et al., 2019; Colombo and Man, 2023; Osnato et al., 2022). This scheduling strategy was not directly tested in this experiment, and any application should be validated and optimized according to species- specific and stage-specific sensitivities (Jackson, 2009).
For plant quality indices, S/R did not differ among treatments, indicating no meaningful shift in shoot-root resource allocation attributable to photoperiod. In contrast, compactness in P. latiovalifolium reached its maximum under the longest photoperiod, suggesting denser shoot biomass accumulation per unit of shoot length under a longer photoperiod. DQI, a widely used integrative metric of overall plant quality (Dickson et al., 1960), was higher under 12–14 h·d-1 in P. latiovalifolium and 14 h·d-1 in P. zokuriensis, indicating that relatively longer photoperiods may generally be associated with improved plant quality in Korean native Phedimus species.
In P. latiovalifolium, the chlorophyll content (SPAD units) decreased markedly under the longest photoperiod, plausibly reflecting a dilution effect, that is, a lower chlorophyll density per unit leaf area accompanying growth expansion. In contrast, the chlorophyll content in P. zokuriensis was highest under the shortest photoperiod. Given that SPAD readings can be influenced by leaf thickness, further investigations are required.
We used the Commission Internationale de l’Éclairage (CIE)-recommended standard color space, CIE 1976 (CIELAB). CIELAB uses the coordinates L*, a*, and b*, which provide an approximately uniform representation across the visible spectrum. CIELAB has been widely adopted as a practical tool for describing plant quality, and its parameters have become the primary metrics for quality assessment in various studies (Lee and Nam, 2023; Lee et al., 2024b; McGuire, 1992; Mohammadzadeh et al., 2025; Post and Schlautman, 2020). The correlations between leaf pigments (chlorophylls and carotenoids) and CIELAB coordinates have been examined (Wei et al., 2024). Applying the same approach to native Phedimus species and taxonomically related genera (e.g., Hylotelephium, Sedum, etc.) will be a valuable direction for future studies.
In our CIELAB results, P. zokuriensis showed a higher L* under the 8–10 h·d-1 photoperiods, indicating a tendency toward increased leaf lightness. In P. takesimensis, the b* coordinate (blue-yellow opponent colors) reached its maximum under the longest photoperiod (14 h·d-1), suggesting relatively more yellowing of the leaves. Such color shifts may indirectly reflect differences in pigment composition (chlorophylls and carotenoids) arising from species-by-photoperiod combinations (Guo et al., 2023; Li et al., 2019; Wei et al., 2024).
Chlorophyll fluorescence analysis provides a rapid, non- invasive means of assessing plant physiological status and photochemical efficiency (Baker, 2008; Chegeni et al., 2024; Jang et al., 2023; Maxwell and Johnson, 2000), and its utility has been demonstrated in several studies (Jang et al., 2025; Jo et al., 2024; Rodríguez-Hernández et al., 2023; Shilpha et al., 2025; Sung et al., 2023). In our study, P. takesimensis exhibited higher Fv/Fm and PIABS under the longest photoperiod, indicating stronger photochemical efficiency and enhanced PSII performance. In contrast, stress-related indicators such as ΦDo, DIo/RC, and ABS/RC tended to be higher under shorter photoperiods (8–10 h·d-1) in P. takesimensis and P. zokuriensis, implying increased energy dissipation and/or a higher proportion of inactive reaction centers under these conditions. In P. zokuriensis, Fv/Fm remained stably high across 10–14 h·d-1, whereas ΦDo and DIo/RC increased under the shortest photoperiod, suggesting that longer or intermediate photoperiods afford greater stability in photochemical efficiency. Comparable trends have been reported elsewhere; for example, in Chrysanthemum spp., photoperiod extension via supplemental lighting significantly improved physiological indicators, such as photosynthetic efficiency and maximum quantum yield (Yang et al., 2022), with similar effects observed in lettuce (Lactuca sativa) (Elkins and van Iersel, 2020) and strawberry (Fragaria × ananassa) (Yang et al., 2024).
Photosynthetic responses are highly sensitive to environmental conditions (Chaves et al., 2009; Jo et al., 2025; Woo and Kim, 2023). Numerous studies have reported that the maximum quantum yield of PSII (Fv/Fm) in non-stressed higher plants typically ranges from 0.78 to 0.84 (Ahn et al., 2024; Kim et al., 2024b; Lee and Nam, 2024; Muniz et al., 2014; Shin et al., 2023). Accordingly, P. latiovalifolium showed values of 0.751–0.769 under 10–14 h·d-1, indicating stress, whereas the 8 h·d-1 treatment yielded 0.781, which is within the normal range. The other two species, P. takesimensis and P. zokuriensis, fell between 0.806 and 0.845 across treatments, which was within or slightly above the normal range, suggesting that they were not stressed and that the PSII reaction centers were largely intact. Conversely, ΦDo exhibited an antagonistic relationship with Fv/Fm, showing a fully contrasting pattern.
Considering the number and interrelatedness of the key variables and indices, we applied PCA to summarize the covarying metrics into two axes (PC1 and PC2). Along PC1, positive loadings reflected increases in plant size parameters (e.g., shoot length, shoot width, stem diameter, and leaf length), biomass components (TFW and TDW), and plant quality indices (compactness, S/R, and DQI), with PIABS contributing slightly in the same direction. In contrast, ABS/RC and DIo/RC were negatively loaded, indicating that superior photochemical performance tended to align with greater growth. PC2 was interpreted as a stress axis, characterized by a relative decline in Fv/Fm accompanied by increases in ΦDo and DIo/RC. From a broader perspective, the variability in photochemical efficiency versus energy dissipation (PC2) was nearly orthogonal to the growth axis (PC1), implying that these processes tend to operate relatively independently of the overall growth level (Galić et al., 2020; Lee et al., 2024c; Wang et al., 2023).
In summary, with respect to enhancing growth, elevating PIABS while suppressing stress-related indicators such as ABS/RC and DIo/RC appears important, whereas maintaining Fv/Fm is central from a stress-management standpoint.
The Pearson correlation coefficient (r) is a dimensionless effect size index that quantifies the strength and direction of the linear association between two variables, ranging from -1 (perfect negative linear association) to +1 (perfect positive), with 0 indicating no linear association (Schober et al., 2018). Pearson correlation analysis showed that increases in biomass components (TFW and TDW) were strongly and positively correlated with increases in plant quality indices (S/R, compactness, and DQI). This represents a typical pattern in which plant size and biomass increase concomitantly in vigorous individuals. Fv/Fm correlated strongly and negatively with DIo/RC, and PIABS correlated negatively with ABS/RC, DIo/RC, and ΦDo, indicating that higher photochemical efficiency and performance are associated with the suppression of energy dissipation and (relatively) fewer inactivated reaction centers. Considering the growth parameters, plant quality indices, and chlorophyll fluorescence parameters, plants with higher PIABS tended to show proportionally greater biomass, whereas higher stress indicators (ΦDo, ABS/RC, and DIo/RC) were inversely associated with biomass. These proportional and inverse relationships suggest that the balance between photochemical efficiency and stress is closely linked to vegetative growth (Perboni et al., 2020; Reis et al., 2021; Sherstneva et al., 2021), underscoring the need to maintain physiological integrity as a prerequisite for healthy plants.
The longest photoperiod simultaneously improved vegetative growth and photochemical efficiency (Fv/Fm and PIABS) in P. takesimensis, whereas P. latiovalifolium showed a pronounced improvement in plant quality (compactness and DQI). In P. zokuriensis, root length and several stress indicators increased under the shortest photoperiod, suggesting that organ-specific developmental targets (shoots vs. roots) and the balance between photochemical efficiency and stress should be considered together. In controlled environments, a species-tailored photoperiod strategy appears appropriate, aimed at maintaining or improving Fv/Fm and PIABS while suppressing excessive increases in ΦDo, ABS/RC, and DIo/RC. However, because these findings are based on an evaluation using photoperiod as a single factor, further studies that incorporate interactions among fundamental environmental cues, such as light quality, light intensity, and temperature, are warranted.
