

Introduction
Materials and Methods
Plant Cultivation and Site Management
Analysis of Photosynthetic Response
Analysis of Quality Traits
Statistical Analysis
Results
Environmental and Soil Conditions
Photosynthetic Response
Growth and Quality Traits
Treatment Performance Score Based on Integrated Traits
Discussion
Environmental Conditions During the Experimental Period
Light Response Models and Physiological Reactions
Growth and Quality Characteristics
Leaf Color and Pigment Index Responses
Multivariate Evaluation Using Radar Chart
Introduction
P. japonicus, commonly known as butterbur, is a perennial herbaceous plant that is cultivated or naturally grows in mountainous regions of Korea, and it is widely used as an edible vegetable. Numerous studies have been conducted on the functional properties of butterbur, highlighting its antioxidant activity (Hiemori-Kondo et al., 2020; Kim et al., 2016, Seo et al., 2008), anti-allergic effects (Choi et al., 2016; Lee et al., 2019; Qian et al., 2016), and neuroprotective properties (Kim et al., 2018; Xu et al., 2016). To ensure a stable supply of these bioactive compounds and achieve high-quality production, light management, especially during the high-temperature summer period, plays a key role in maintaining stable growth and product quality.
Photosynthesis is a core physiological process closely related to plant growth and yield (Evans, 2013), and it is greatly affected by light conditions. The light response curve, which represents changes in the net photosynthetic rate (Pn) in response to varying photosynthetic photon flux density (PPFD), serves as an essential tool for evaluating a plant’s photosynthetic efficiency and adaptability to light environments (Lambers et al., 2008). Accurate modeling of photosynthetic light response curves is essential for understanding how plants acclimate to varying light conditions, particularly under artificial shading. Several mathematical models have been developed to describe the relationship between photosynthetic rate and photosynthetic photon flux density (PPFD), each with distinct assumptions and fitting characteristics. The selection of an appropriate model is crucial, as it influences the estimation of key physiological parameters such as the maximum net photosynthetic rate (Pnmax), apparent quantum yield (AQY), light compensation point (LCP), and light saturation point (LSP). Various nonlinear regression models have been employed to interpret photosynthetic light response curves, each offering different strengths in fitting accuracy and physiological relevance. The Rectangular Hyperbola model (Baly, 1935; Smith, 1936) provides a simple and widely used framework. The Non-Rectangular Hyperbola model (Platt and Jassby, 1976; Ye, 2007) and the Exponential model (Prado and De Moraes, 1997; Webb et al., 1974) are also commonly used to describe photosynthetic light response curves. Applying and comparing these models allows for a more robust estimation of light-response parameters under varying shading conditions in P. japonicus.
Shading is a cultivation practice used to alleviate light stress and prevent physiological damage from light saturation or inhibition. It influences photosynthetic parameters like LCP and LSP (Wang et al., 2014; Zhou et al., 2010) and is closely tied to the plant’s light adaptation strategies. Deguchi and Koyama (2020) showed that P. japonicus grown in high and low light environments exhibited significant differences in net photosynthetic rate, dark respiration, and leaf area, indicating distinct photosynthetic and morphological adaptations to light conditions.
Plants generally exhibit one of two adaptive strategies in response to shading: shade avoidance and shade tolerance. Shade avoidance involves morphological changes such as stem elongation and increased leaf area to capture more light (Ballaré and Pierik, 2017; Romanowski et al., 2021), while shade tolerance maintains photosynthetic efficiency and growth in low-light conditions through physiological and molecular mechanisms (Valladares and Niinemets, 2008). Recent studies have revealed that shade tolerance involves fine-tuned regulation of photoreceptors, transcription factors, and photosynthesis-related gene networks (Martinez-Garcia and Rodriguez-Concepcion, 2023)
Therefore, a quantitative analysis of photosynthetic responses and quality-related traits of P. japonicus under various shading conditions is essential to understand its physiological adaptation and to determine optimal cultivation practices for stable, high-quality production. However, studies applying nonlinear photosynthetic models to quantify light responses in P. japonicus remain limited, and few have evaluated the predictive accuracy and interpretability of different models.
This study aimed to comprehensively analyze changes in photosynthetic responses and quality traits of P. japonicus under different shading levels. It contributes to our understanding of light adaptation in butterbur and provides foundational data for developing scientifically informed cultivation strategies.
Materials and Methods
Plant Cultivation and Site Management
1) Experimental Materials, Cultivation Conditions, and Environmental Monitoring
This experiment was conducted from spring to summer 2025 at the Wild Vegetable Research Center in Pyeongchang-gun, Gangwon State, South Korea. The experimental crop was Petasites japonicus. Rhizomes weighing 5–10 g were transplanted on May 12, and plants were harvested on July 2 for growth and quality assessments. Thirty plants were cultivated under each shading treatment, with three replications based on total yield. Each replicate was treated as an independent plot.
Shading levels were established using shade nets to achieve four treatments: no shading (control), and 35%, 55%, and 90% shading, which were maintained consistently throughout the study. Climate conditions in the plots were automatically recorded every hour using a data logger (HOBO Micro Station, Onset Computer Corporation, USA). Temperature and relative humidity were monitored using the S-THC-M002 sensor, and light intensity was measured using the S-LIB-M003 quantum sensor.
2) Soil Sampling and Chemical Analysis
The soil was not classified by texture, but the field consisted of typical upland soil used for vegetable cultivation. Prior to transplanting, all plots were uniformly tilled and amended with compost. Before planting, soil samples were collected from each treatment plot and subjected to chemical property analysis. The analyses included pH (1:5 soil-to-water ratio), electrical conductivity (EC), soil organic matter (SOM), available phosphorus (P2O5), and exchangeable cations (Ca2+, K+, Mg2+). During the cultivation period, irrigation was applied uniformly across all treatments to maintain consistent soil moisture conditions. All management practices other than shading were standardized to isolate the effects of light availability on plant responses.
Analysis of Photosynthetic Response
1) Measurement of Photosynthetic Response
Photosynthetic traits were assessed using a portable photosynthesis system (LI-6800, LI-COR Biosciences, USA). Fully expanded mature leaves from representative plants in each treatment group were selected for measurement. Gas exchange measurements were conducted under controlled conditions: a block (air) temperature of 25°C, a constant reference CO2 concentration of 400 μmol mol-1, and relative humidity of 60%. Light intensity (PPFD) was adjusted stepwise as follows: 0, 25, 50, 100, 200, 400, 600, 800, 1,000, 1,200, 1,500, 1,800, and 2,000 μmol m-2 s-1. Measurements were conducted between 08:00 and 14:00 to minimize diurnal variation. Leaves were fully light-acclimated before measurement, and three leaves were measured per treatment over four days. The order of treatment measurement was randomized to reduce environmental bias.
2) Light Response Model Fitting and Parameter Estimation
Three commonly used nonlinear light response models were fitted: Rectangular Hyperbola, Non-Rectangular Hyperbola, and Exponential models. The models are defined as follows:
Rectangular Hyperbola
Non-Rectangular Hyperbola:
Exponential
Pn: Net photosynthetic rate (μmol CO2 m-2 s-1), I: PPFD (μmol photons m-2 s-1), Pnmax: Maximum net photosynthetic rate, k: Half-saturation constant, Rd : Dark respiration rate, 𝛷: Apparent quantum yield, θ : Curvature factor (in the non- rectangular model).
Model parameters were estimated using the curve fit function from Python’s SciPy package under a non-linear least squares optimization method. Initial values were set based on the distribution and maximum values of each dataset.
3) Model Evaluation and Statistical Analysis
Model fit was evaluated by comparing predicted and observed values using R2, RMSE, Akaike Information Criterion (AIC), and Bayesian Information Criterion (BIC). The model with the lowest AIC for each sample was considered optimal. The frequency of best-fitting models was compared, and Friedman’s test was used to assess statistical differences among models. All data processing, curve fitting, statistical analysis, and visualization were conducted in Python. The primary libraries used included pandas, numpy, scipy, matplotlib, seaborn, and scikit-learn. Predicted light response curves were visualized based on treatment and group averages.
Analysis of Quality Traits
1) Leaf Area Measurement
Thirty representative leaves per treatment were selected, and leaf area was measured using a leaf area meter (LI-3100, LI-COR Biosciences, USA).
2) Quantification of Textural Firmness Using Mechanical Penetration
Leaf hardness was measured on the center of each leaf using a texture analyzer (BROOKFIELD, USA) equipped with a round probe (TA44, 4 ㎜ diameter). Measurements were recorded in grams-force (gf).
3) Image-Based Leaf Color Evaluation and SPAD Estimation
Leaf color was evaluated through image analysis. Photos were taken using a smartphone (Galaxy Z Flip6, Samsung Electronics, Korea) under LED lighting and calibrated with a standard color chart (Calibrite ColorChecker Classic). Camera settings were fixed (ISO 100, white balance 5500 K, manual focus).
Image processing was conducted in Google Colaboratory using Python 3.10, OpenCV 4.10, pandas 2.2.2, matplotlib 3.8, and rembg 2.0.50. The background was removed using the AI-based rembg tool, and calibrated images were used to extract RGB and HSV values from the leaf area using OpenCV. The average values per sample were saved in CSV format. Chlorophyll content was also assessed using a SPAD meter (SPAD-502, Konica Minolta, Japan).
Statistical Analysis
1) Analysis of Variance Across Shading Treatments
Statistical analysis was conducted using Python 3.11. Data were processed with pandas and numpy; visualization was performed with matplotlib and seaborn; and statistical tests were carried out using statsmodels and scipy. One-way ANOVA was used to test treatment effects, with Levene’s test applied to verify homogeneity of variances. Where homogeneity was satisfied, Tukey’s HSD test was used for post hoc comparisons. The significance level was set at p &5.
2) Multivariate Evaluation with Z-score and Radar Chart
To comprehensively evaluate plant performance under different shading treatments, seven key traits were selected: yield, SPAD value, maximum net photosynthetic rate (Pnmax), apparent quantum yield (AQY), dark respiration rate (Rd), leaf area, and leaf hardness.
To enable comparison across variables with different scales and units, values were standardized using Z-score normalization, calculated as follows:
where X is the original value, μ is the mean, and σ is the standard deviation of each trait.
For leaf hardness, extreme values (too hard or too soft) may be undesirable. Thus, hardness values were centered around the median, and the absolute deviation from the median was used to penalize outliers. This was then sign-inverted so that values closer to the median received higher scores:
For dark respiration rate (Rd), where lower values are more desirable, the direction of contribution was reversed by sign inversion:
After adjustment, all variables were standardized using Z-score transformation. A radar chart was generated to visualize trait profiles for each shading treatment, and the sum of Z-scores across all variables was calculated as a composite performance index for integrated evaluation.
All preprocessing, transformation, and visualization were conducted in Python using the pandas, numpy, scikit-learn, and matplotlib libraries.
Results
Environmental and Soil Conditions
1) Environmental Conditions During the Experimental Period
‘Climate conditions in the experimental plots under different shading treatments are summarized in Table 1 and 2. The average daytime temperature under full sunlight (control) was 21.7°C and slightly decreased as shading increased, reaching 20.7°C under 90% shading. Nighttime temperatures ranged from 16.7 to 17.0°C across all treatments. Maximum and minimum temperatures were similar across treatments, at 34.9–35.7°C and 2.9–3.1°C, respectively. Relative humidity ranged between 79.5% and 83.4%, with the highest humidity observed under the 55% shading treatment.
Table 1.
Temperature and relative humidity under different shading levels.
Table 2.
Light intensity and relative irradiance by shading level. Mean and maximum light intensity, and relative light transmission (%) measured under each shading level.
| Shading level | Mean light intensity (W·m-2) | Maximum light intensity (W·m-2) | Relative light intensity (%)z |
| Control | 198.2 | 1209.4 | 100.0 |
| 35% shading | 81.1 | 516.9 | 40.9 |
| 55% shading | 60.4 | 458.1 | 30.5 |
| 90% shading | 11.4 | 93.1 | 5.8 |
Light intensity showed substantial differences among shading levels. The average irradiance under control conditions was 198.2 W/㎡, decreasing to 81.1, 60.4, and 11.4 W/㎡ under 35%, 55%, and 90% shading, respectively. Maximum irradiance followed a similar pattern. Relative irradiance under 35% and 90% shading treatments corresponded to 40.9% and 5.8% of the full sunlight, respectively. These differences in light environment served as major variables influencing subsequent growth and photosynthetic responses.
2) Soil Chemical Properties under Different Shading Levels
The soil chemical properties measured after applying different shading levels showed minor variations among treatments (Table 3). Soil pH ranged from 6.8 to 7.0, with no substantial difference across treatments. Electrical conductivity (EC) values ranged between 3.87 and 5.81 dS/m, showing a slightly lower value at 55% shading but no consistent trend in relation to shading intensity. Soil organic matter (SOM) remained relatively stable across treatments, ranging from 33.7 to 34.2 g/㎏. Among the exchangeable cations, calcium (Ca) content was highest in the Control plot (13.34 cmol(+)/㎏) and lowest under 55% shading (11.24 cmol(+)/㎏). Potassium (K) and magnesium (Mg) also showed minor fluctuations but no clear shading-dependent pattern. Available phosphorus (P2O5) was slightly reduced under increased shading, decreasing from 1331.3 ㎎/㎏ (Control) to 1279.2 ㎎/㎏ (55% shading).
Table 3.
Soil chemical properties of P. japonicus under different shading levels. Data represent pH (1:5), electrical conductivity (EC), soil organic matter (SOM), exchangeable cations (Ca, K, Mg), and available phosphorus (P2O5).
Photosynthetic Response
1) Model Fit Comparison for Light Response Curves
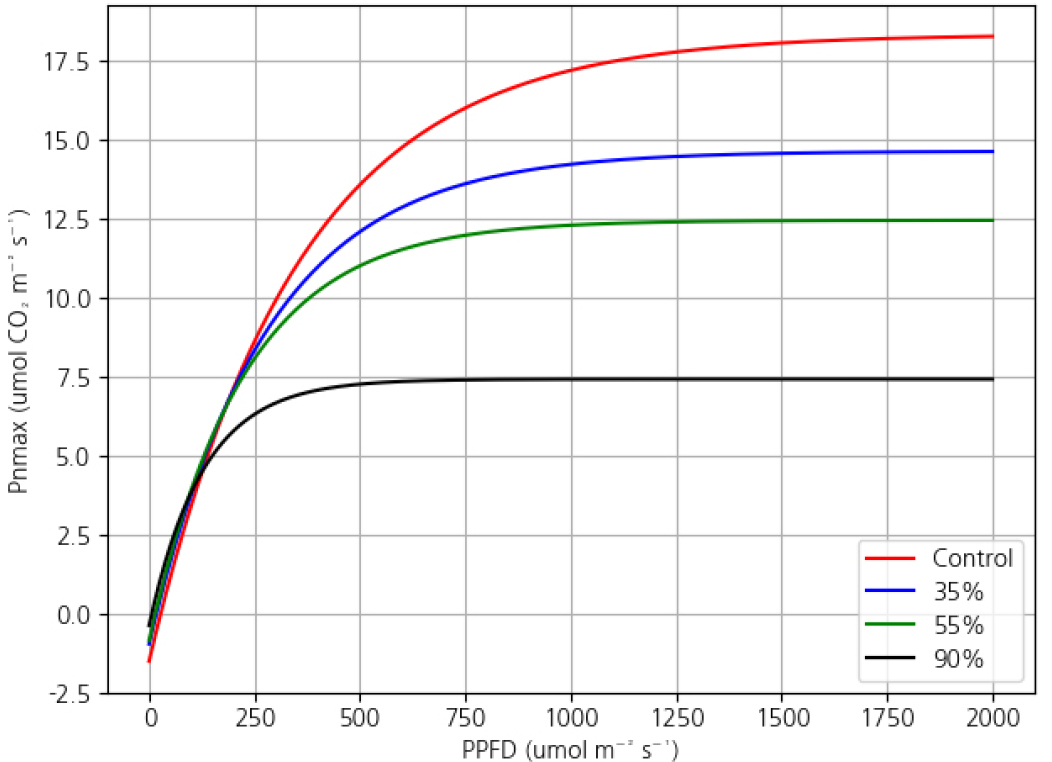
To evaluate shading effects on photosynthesis, light compensation point (LCP) and light saturation point (LSP) were estimated using three common response models: Rectangular Hyperbola, Non-Rectangular Hyperbola, and Exponential (Table 4). The models yielded markedly different LCP and LSP values. In particular, the Rectangular model often produced fixed or unrealistic LSP values (2,000 μmol m-2 s-1), regardless of shading level. In contrast, the Exponential model showed a consistent decline in both LCP and LSP with increasing shade intensity, indicating better sensitivity to light availability.
Table 4.
Light compensation point (LCP) and light saturation point (LSP) of P. japonicus under different shading levels as estimated by three photosynthetic response models (Rectangular hyperbola, Nonrectangular hyperbola, and Exponential). Values represent mean ± standard deviation (n = 12). LCP and LSP are in μmol photons m-2 s-1.
Model performance was further compared using statistical indicators including R2, RMSE, AIC, and BIC (Table 5). The Exponential model achieved the best overall fit, with the highest average R2 (0.9970), lowest RMSE (0.2276), and most negative AIC and BIC scores. It was selected as the best-fitting model for 48 out of 60 individual samples based on AIC. Friedman’s test revealed significant differences among models (statistic = 80.167, p &01), indicating that model performance varied substantially.
Table 5.
Comparison of model fitting statistics for light-response curves in P. japonicus. The exponential model exhibited the highest coefficient of determination (R2), lowest RMSE, and the most negative AIC/BIC values, indicating the best model fit.
Visual comparison of predicted light response curves (Fig. 1) showed that the Rectangular Hyperbola model tended to overestimate photosynthesis under high light conditions, while the Non-Rectangular model showed unrealistic curve bending in the mid-range (400–800 μmol m-2 s-1), likely due to overfitting. In contrast, the Exponential model consistently captured the gradual saturation behavior of photosynthesis and showed high agreement with observed data(model fitting to a single sample leaf as an example).

2) Comparison of Photosynthetic Parameters
Key photosynthetic parameters (Pnmax, Rd, AQY, LCP, LSP) derived from the Exponential model exhibited significant differences among shading treatments (Table 6).
Table 6.
Photosynthetic parameters by shading treatment (Pnmax, Rd, AQY, LCP, LSP). Photosynthetic parameters of P. japonicus including maximum net photosynthetic rate (Pnmax), dark respiration rate (Rd), apparent quantum yield (AQY), light compensation point (LCP), and light saturation point (LSP) under different shading conditions. and (μmol CO2 m-2 s-1), AQY(mol CO2 mol-1 photons), LCP and LSP are in μmol photons m-2 s-1.
| Shading level | Pnmax | Rd | AQY | LCP | LSP |
| Control | 19.87 ± 1.28az | 1.52 ± 0.30a | 0.06 ± 0.00a | 28.12 ± 6.05a | 1418.42 ± 330.78a |
| 35% shading | 15.62 ± 1.13b | 0.98 ± 0.27b | 0.06 ± 0.01a | 17.82 ± 4.37b | 1009.80 ± 336.51b |
| 55% shading | 13.31 ± 0.92c | 0.86 ± 0.67b | 0.06 ± 0.00a | 15.51 ± 13.59b | 786.71 ± 387.41b |
| 90% shading | 7.80 ± 0.58d | 0.39 ± 0.13c | 0.06 ± 0.00a | 6.54 ± 2.15c | 391.87 ± 51.29c |
Pnmax (maximum net photosynthetic rate) was highest under full sunlight (19.87 µmol m-2 s-1) and decreased significantly with increasing shading. The lowest value was observed under 90% shading (7.80 µmol m-2 s-1), indicating that heavy shading severely inhibited photosynthetic capacity.
Rd (dark respiration rate) was also highest under full sunlight and declined as shading increased, reaching 0.39 µmol m-2 s-1 under 90% shading.
AQY (apparent quantum yield) did not show significant differences among treatments and remained around 0.06 on average.
LCP (light compensation point) was highest in the control and lowest under 90% shading, indicating a reduced light requirement under heavier shading.
LSP (light saturation point) also declined with increased shading, from 1,418.42 µmol m-2 s-1 in the control to 391.87 µmol m-2 s-1 under 90% shading.
Visualization of light response curves using the Exponential model (Fig. 2) confirmed these trends. The saturation point of Pn was highest under full light and gradually decreased with increasing shading, with the 90% treatment showing a flattened response, reflecting reduced light-use efficiency.
Growth and Quality Traits
1) Fresh Weight, Leaf Area, and Leaf Hardness
Significant differences in fresh weight, leaf area, and stem hardness were observed across treatments (Table 7, Fig. 3). Fresh weight was highest under 55% shading (880.00 ± 144.22 g), followed by 35% (713.33 ± 192.18 g) and the control (686.66 ± 50.33 g). The lowest value was recorded under 90% shading (240.00 ± 87.17 g). Leaf area was also significantly different. The 55% shading treatment had the highest mean value (163.42 ± 22.20 ㎠), while 35% (128.48 ± 8.56 ㎠), control (106.92 ± 21.89 ㎠), and 90% (101.40 ± 8.23 ㎠) followed. Leaf hardness was highest under full sunlight (248.26 ± 14.39 gf), with all shaded treatments showing significantly lower values, likely due to reduced mechanical tissue development.
Table 7.
RGB, HSV, and SPAD values with significance grouping. Mean ± standard deviation of fresh weight, leaf area, and leaf hardness of P. japonicus under different shading levels.
| Shading level | Fresh weight (g) | Leaf area (㎠) | Leaf hardness (gf) |
| Control | 686.66 ± 50.33abz | 106.92 ± 21.89b | 248.26 ± 14.39a |
| 35% shading | 713.33 ± 192.18ab | 128.48 ± 8.56ab | 167.80 ± 2.26b |
| 55% shading | 880.00 ± 144.22a | 163.42 ± 22.20a | 141.96 ± 20.26b |
| 90% shading | 240.00 ± 87.17c | 101.40 ± 8.23b | 146.00 ± 15.48b |
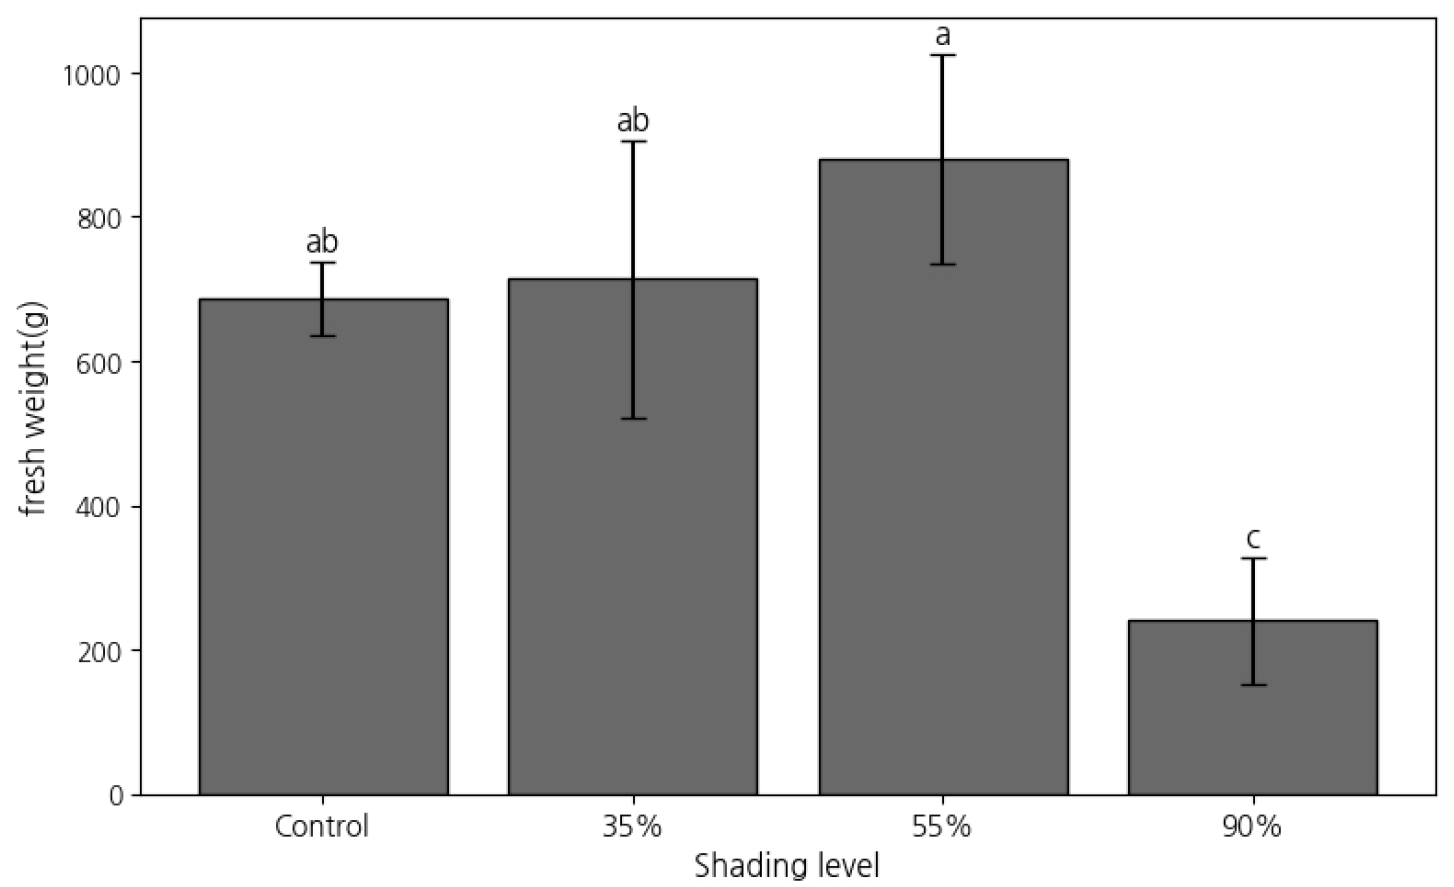
Fig. 3.
Fresh Weight of P. japonicus under Different Shading Levels. Mean fresh weight (g per 30 plants) of P. japonicus under different shading levels (Control, 35%, 55%, and 90%). Error bars represent standard deviation (n = 3). Different letters above bars indicate significant differences based on Tukey’s HSD test (p &5).
2) Leaf Color and SPAD
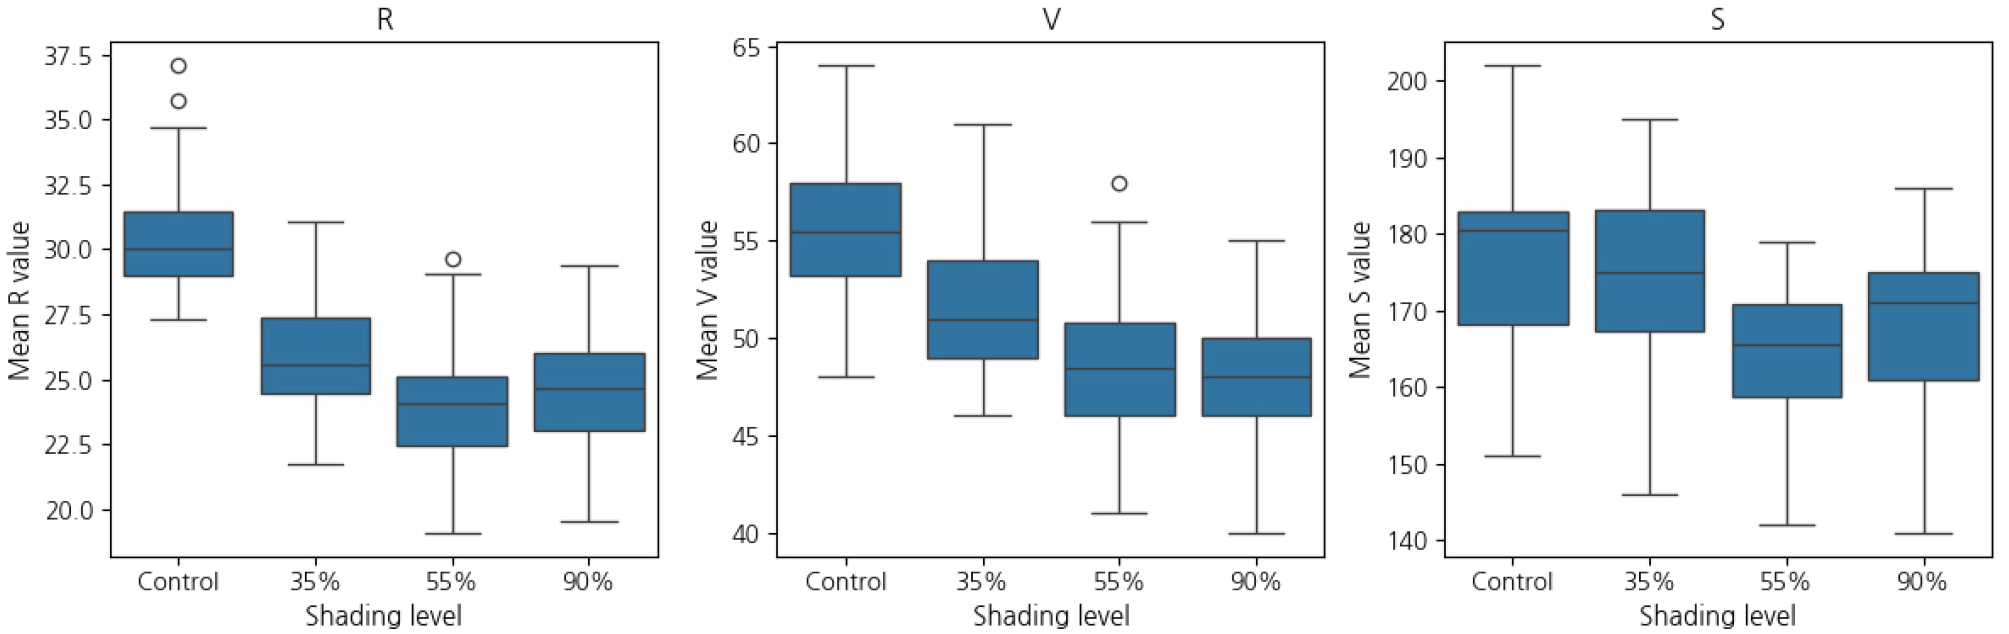
RGB and HSV color indices and SPAD values showed distinct differences by treatment (Table 8). Value (V) was highest under control (55.70 ± 3.57), gradually decreasing under 35%, 55%, and 90% shading (51.80 ± 3.84, 48.40 ± 4.13, and 48.00 ± 3.42, respectively). Red (R) was also highest in the control (30.66 ± 2.35), followed by 35% (25.67 ± 2.22), 90% (24.73 ± 2.19), and 55% (23.90 ± 2.46). Green (G) and saturation (S) were significantly affected by shading, highest in the control. Hue (H) differed significantly among treatments, with the 55% treatment showing the highest value (54.10 ± 1.86). Blue (B) values showed no significant differences.
Table 8.
Light compensation and saturation points by model and shading level. Mean ± standard deviation of leaf RGB and HSV color indices and SPAD values in P. japonicus under different shading conditions.
| Shading level | R (Red) | G (Green) | B (Blue) | H (Hue) | S (Saturation) | V (Value) | SPAD Value |
| Control | 30.66 ± 2.35az | 56.17 ± 3.48a | 17.51 ± 2.51a | 50.07 ± 1.08a | 177.10 ± 11.65a | 55.70 ± 3.57a | 29.16 ± 1.56b |
| 35% shading | 25.67 ± 2.22b | 52.34 ± 3.73b | 16.52 ± 2.03a | 52.53 ± 1.48b | 174.87 ± 12.19a | 51.80 ± 3.84b | 32.30 ± 0.35a |
| 55% shading | 23.90 ± 2.46c | 48.94 ± 4.05c | 17.50 ± 1.53a | 54.10 ± 1.86c | 164.73 ± 8.47b | 48.40 ± 4.13c | 32.47 ± 0.72a |
| 90% shading | 24.73 ± 2.19bc | 48.54 ± 3.44c | 16.88 ± 1.83a | 52.77 ± 1.63b | 167.67 ± 9.82b | 48.00 ± 3.42c | 31.55 ± 1.16ab |
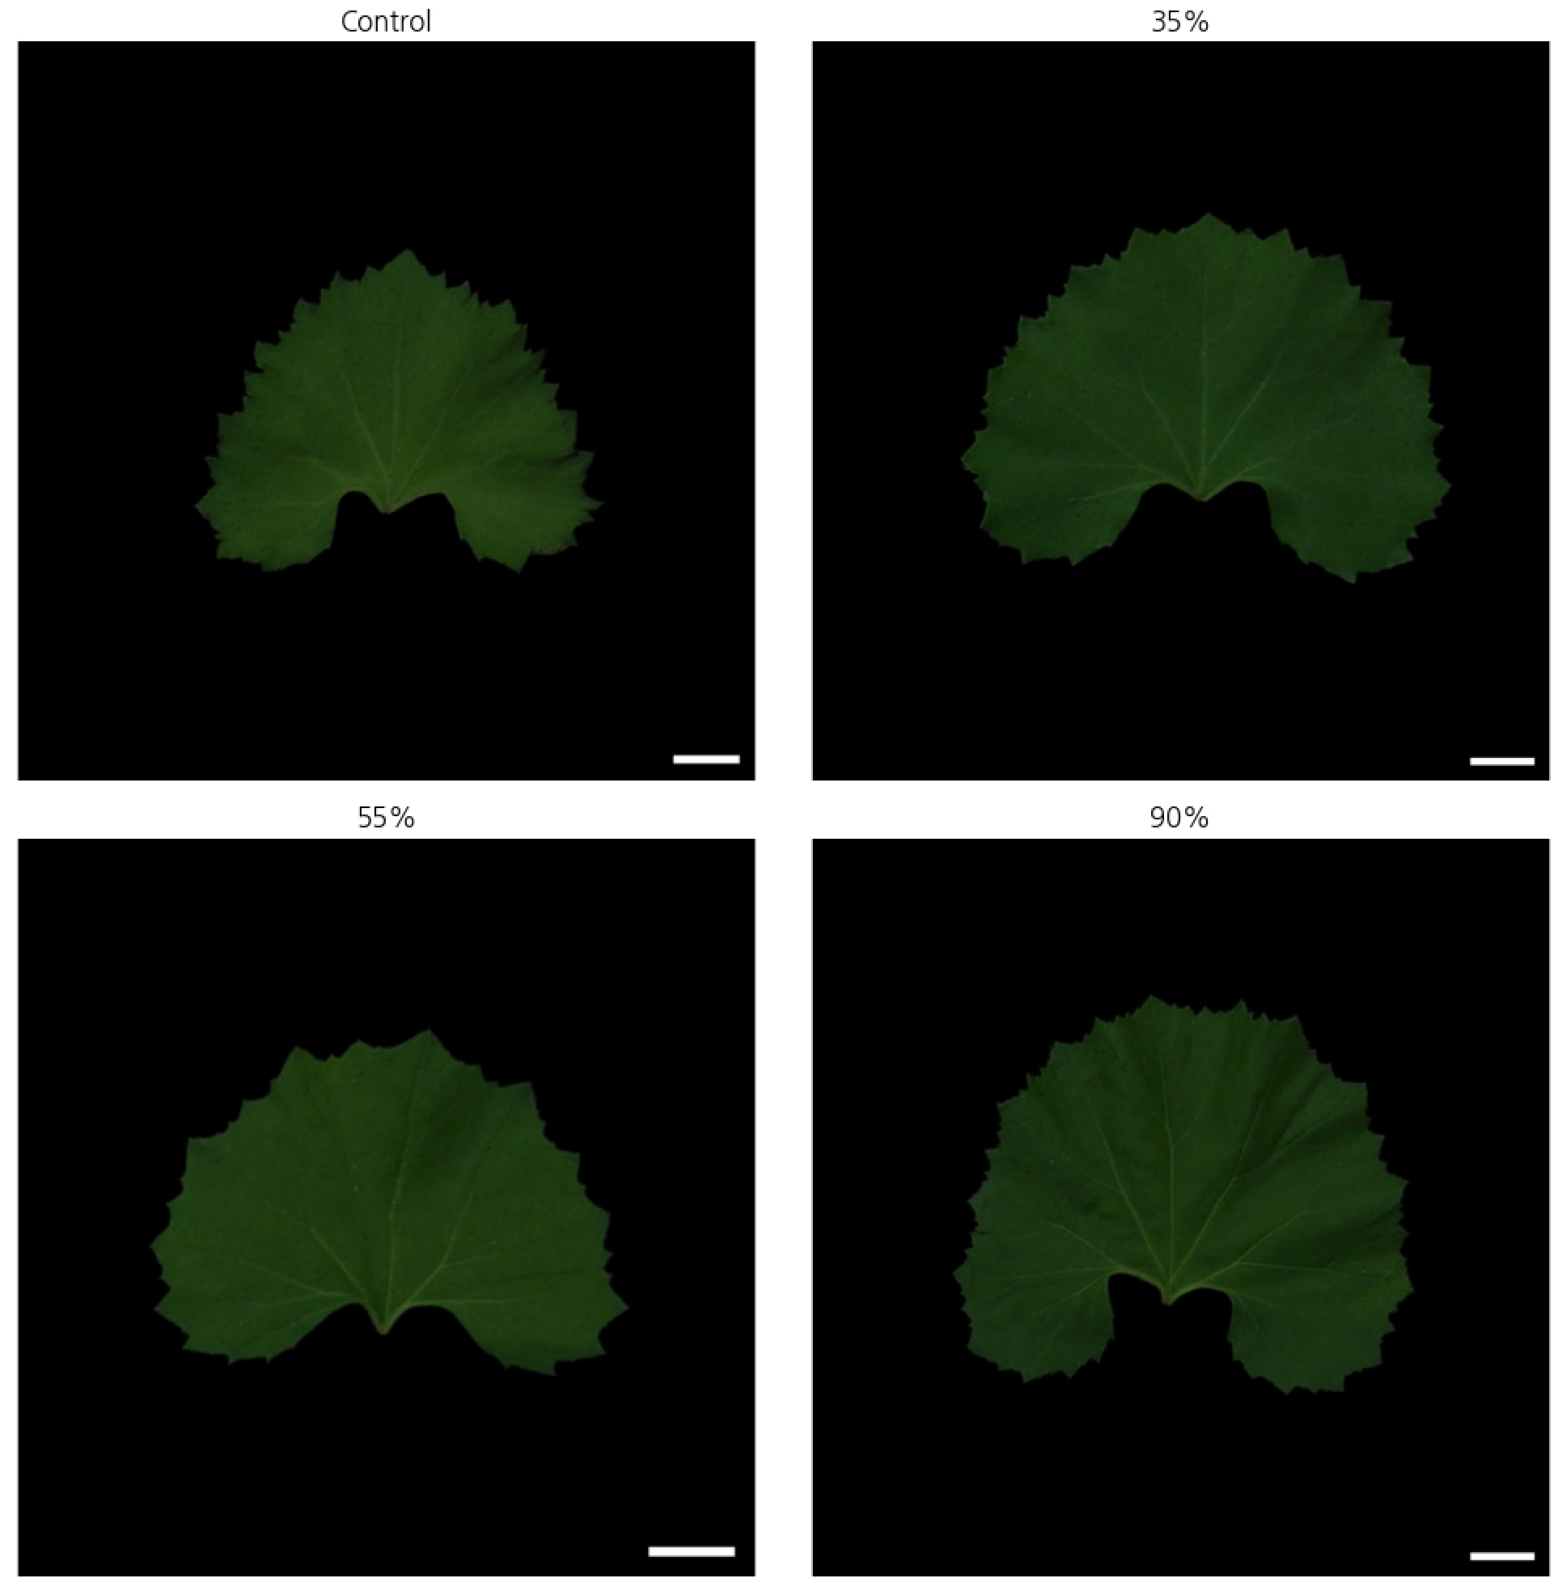
These results indicate that leaf color responded sensitively to shading, particularly in V, R, and S values. Higher shading levels led to darker and less saturated leaf colors. Fig. 4 provides representative leaf images for each treatment, visually demonstrating these changes.
Boxplots for R, V, and S values (Fig. 5) showed distinct treatment-based trends. SPAD values were lowest in the control (29.17 ± 1.57), and significantly higher under 35% (32.30 ± 0.36) and 55% (32.47 ± 0.73) shading.
Treatment Performance Score Based on Integrated Traits
To comprehensively assess the growth and quality of P. japonicus under different shading levels, seven physiological and agronomic traits (Yield, SPAD, Pnmax, AQY, Rd, Hardness, and Leaf Area) were standardized using Z-score normalization. For trait integration, dark respiration rate (Rd) was multiplied by –1 so that lower respiration values contributed positively to the overall score. Leaf hardness was transformed into a centered score by calculating the negative absolute difference from the median value across treatments, emphasizing moderate values as optimal. These transformations ensured that all trait directions aligned consistently before Z-score normalization and summation. After normalization, values were summed across all traits to yield an integrated performance score for each treatment (Fig. 6). As shown in the radar chart, the 55% shading treatment exhibited the most balanced and superior performance across traits, with the highest integrated score (4.43). The 35% shading treatment also showed a positive score (1.07), indicating favorable physiological responses. In contrast, the control and 90% shading treatments yielded negative scores (–4.95 and –0.55, respectively), indicating suboptimal performance under full sunlight or excessive shading. This integrated trait analysis supports the conclusion that moderate shading (particularly 55%) optimizes both physiological activity and yield-related traits in P. japonicus cultivation.
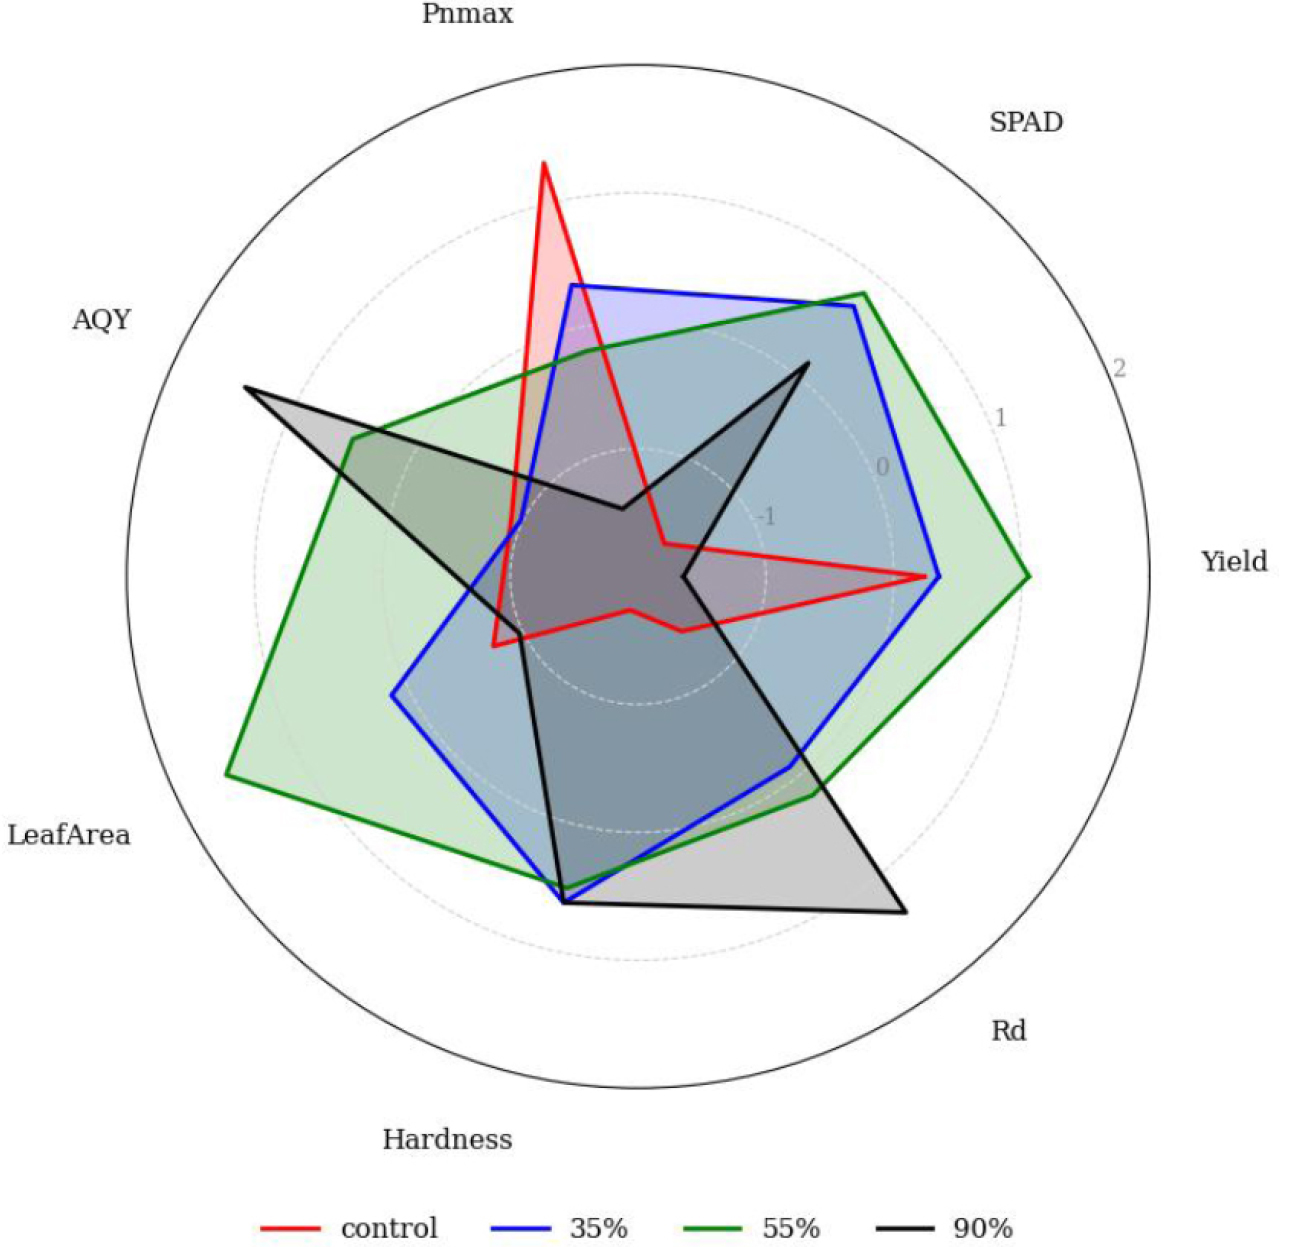
Fig. 6.
Radar chart of standardized growth and physiological traits under different shading levels. Standardized radar plot of seven key traits in P. japonicus under four shading treatments (control, 35%, 55%, and 90% shading). Traits include yield, SPAD, , AQY, leaf area, hardness, and (dark respiration). Values were directionally adjusted—such as multiplying by –1 and centering hardness around the median—to ensure uniform contribution to performance. Each trait was then standardized using Z-scores. The chart visualizes relative performance across treatments; the 55% shading treatment exhibited the highest overall composite score.
Discussion
Environmental Conditions During the Experimental Period
Among environmental factors, light is one of the most direct influences on plant growth and photosynthesis. In this study, light intensity was the major variable altered by shading treatments. The control plots received approximately 198 W/㎡ on average, while the 90% shading treatment received only 11.4 W/㎡, representing a significantly light-limited environment. This reduced light may have prevented light inhibition but also limited photosynthesis and growth.
Light Response Models and Physiological Reactions
Analysis of the light response curves revealed that the Exponential model provided the most accurate and stable fit across treatments, as shown by the highest R2 and the lowest RMSE, AIC, and BIC values. In contrast, the Rectangular Hyperbola overestimated photosynthesis under high light (Guo and Lv, 2025; Wang et al., 2024), while the Non- Rectangular Hyperbola showed excessive curve bending under moderate light (Yang et al., 2024; Ye et al., 2021), indicating overfitting. This discrepancy is due to structural differences among models. For P. japonicus, which is relatively adapted to low-light environments, the Exponential model best represented its gradual saturation response.
LCP and LSP values derived from all models decreased with increasing shading. Notably, the Rectangular model returned a fixed LSP value (2,000) for all treatments due to its structural upper limit, while the Non-Rectangular model overestimated LSP under 90% shading. The Exponential model provided a more realistic and responsive estimate under limited light, supporting its suitability for light adaptation studies in shade-tolerant crops like butterbur.
However, AQY did not differ significantly across treatments and remained stable (~0.06). This suggests that initial photochemical efficiency in P. japonicus is relatively insensitive to shading. Similar findings have been reported where AQY failed to distinguish shade-tolerant mechanisms (Fox et al., 2022). Given that AQY was calculated via regression using the Exponential model, the model’s smooth curve may have limited AQY variability. Future studies should consider complementary methods such as chlorophyll fluorescence analysis.
Pnmax declined significantly with increasing shading, especially under 90%, where it dropped to 7.80 μmol m-2 s-1. This indicates that severe light limitation greatly inhibits carbon assimilation. Rd followed a similar trend, decreasing with shading, likely due to suppressed respiratory activity under low light. LCP and LSP both declined with shading, with intermediate shading (35–55%) appearing optimal for efficient light utilization.
Growth and Quality Characteristics
Fresh weight and leaf area peaked under 55% shading, indicating that intermediate light levels optimized both photosynthesis and biomass accumulation. This suggests that P. japonicus benefits from moderated light, likely due to minimized stress and sufficient light absorption.
Leaf hardness was highest in the control and declined with increasing shading. High light generally promotes denser tissues with thicker cell walls, while shaded conditions lead to softer tissues due to enlarged intercellular spaces and lower density (Fan et al., 2019; Feng et al., 2019). Three-dimensional anatomical analyses of mesophyll tissues have shown that leaves grown under high light have thicker tissues, lower porosity, and more developed diffusion pathways from stomata to mesophyll surfaces (Luo et al., 2023; Théroux‑Rancourt et al., 2023). Therefore, a trade-off exists between yield and tissue firmness, and shading should be adjusted depending on whether soft texture or storage stability is prioritized.
Leaf Color and Pigment Index Responses
Light is a primary regulator of pigment biosynthesis and leaf color. Changes in light availability can alter chlorophyll and pigment composition (Chen et al., 2021; Dai et al., 2009; Rezai et al., 2018). While RGB and HSV values are not direct physiological indicators, they often correlate well with chlorophyll and pigment content and serve as useful proxies (Yadav et al., 2010; Zhang et al., 2022).
In this study, leaf brightness (V) and R, G, and S clearly decreased with increasing shading. These patterns likely reflect changes in pigment composition. Notably, SPAD values increased under moderate shading (35–55%), suggesting that P. japonicus exhibits physiological adaptation to intermediate light levels. Numerous studies report increased chlorophyll a and b concentrations under low-light conditions due to enhanced biosynthesis pathways (An et al., 2022; Chen et al., 2021). While this study assessed SPAD as a proxy, further investigations using direct chlorophyll quantification and fluorescence techniques are recommended.
Multivariate Evaluation Using Radar Chart
The composite score, calculated as the sum of Z-scores, indicated that 55% shading achieved the best overall performance, followed by 35%, 90%, and control. Although the control group showed high Pnmax, it performed poorly in traits like AQY and leaf expansion. In contrast, 55% shading maintained balanced performance across all traits. Traits such as Rd and hardness were adjusted to reflect desirable directions before standardization, allowing meaningful integration. This multivariate approach highlights how moderate shading can improve overall plant performance by balancing photosynthetic efficiency and morphological development. To ensure comparability, traits like Rd and hardness were directionally adjusted prior to standardization. However, this approach is limited by the selection and weighting of traits, and the assumption that all variables contribute equally to plant performance.
Based on the observed improvements in photosynthetic efficiency and morphological traits, moderate shading (approximately 55%) appears to be the most suitable condition for cultivating P. japonicus under summer environments. This shading level may help optimize both physiological performance and leaf quality, providing practical guidance for growers aiming to improve productivity during periods of high light intensity.
