

Introduction
Materials and Methods
Plant materials
Chemicals and reagents
Sample and standard preparation
Apparatus and analytical conditions
Method validation
Determination of soil-chemical properties
Statistical and multivariate analysis
Results and Discussion
HPLC-UV method validation
Quantitative analysis of bioactive compounds
Soil properties
Correlation between soil properties and bioactive compounds of A. tegmentosum
Acknowledgements
Introduction
Acer tegmentosum Maxim, belongs to the Aceraceae family, is a type of deciduous tree that grows in Korea, Russia and northern China (Korea National Arboretum, 2020). In Asia, A. tegmentosum has been used as a traditional medicine for treatment of various ailments. In general, the stem is used for treating traumatic bleeding, and the leaves and stem were used to treat liver diseases such as hepatitis, cirrhosis, liver cancer, leukemia, diabetes, and nephritis (Oh et al., 2017). In addition, leaf extract of A. tegmentosum has anticancer and antioxidant (Eo et al., 2020a). Phytochemical investigations have shown that these plants include five classes of major constituents, including flavonoids and phenethyl glycosides, phenol compounds, steroids and tannins (Hatano et al., 1990; Lee et al., 2017; Park et al., 2006; Song et al., 2014).
The medicinal properties used by humans are a combination of species-specific secondary metabolites in plants. Secondary metabolites play an important role in the physiological function of plants. In general, about 1500 types secondary metabolites are extracted from plants every year and about 300 of them are considered as bioactive materials. Most of the plant-generated secondary metabolites are also used for making dyes, polymers, fibers, adhesives, oils, waxes, spices, and perfumes and are also considered useful for developing new medicines, antibiotics, pesticides, and herbicides (Park et al., 2020).
A number of studies have been conducted on the isolation of bioactive compounds from A. tegmentosum, but studies concentrating on the suitability soil chemical properties for the cultivation of A. tegmentosum are insufficient. Studies need to be conducted for increasing the bioactive compounds content is needed to improve the quality of A. tegmentosum in Korea is needed.
In this study, we aimed to analyze the correlation between bioactive compounds of A. tegmentosum and soil physico- chemical properties of cultivation regions.
Materials and Methods
Plant materials
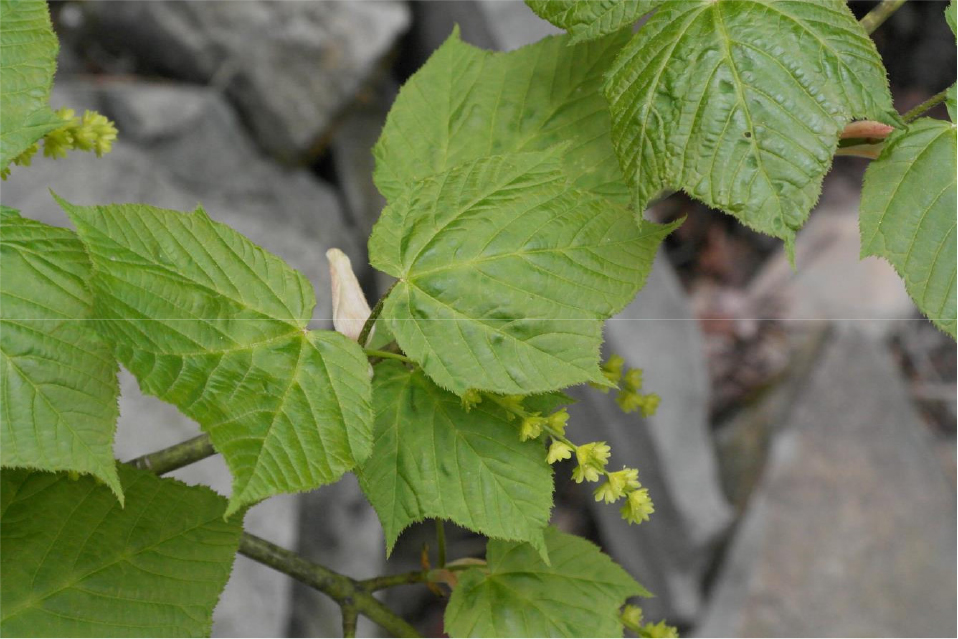
In this study, a total of 57 samples of stem parts were collected from 19 cultivation located in 14 local provinces during October - November, 2019. The samples used in the study has identified the taxonomic identification of the research team and the confirmatory sample of the sample is being stored in the Forest Medicinal Resources Research Center (Fig. 1).
Chemicals and reagents
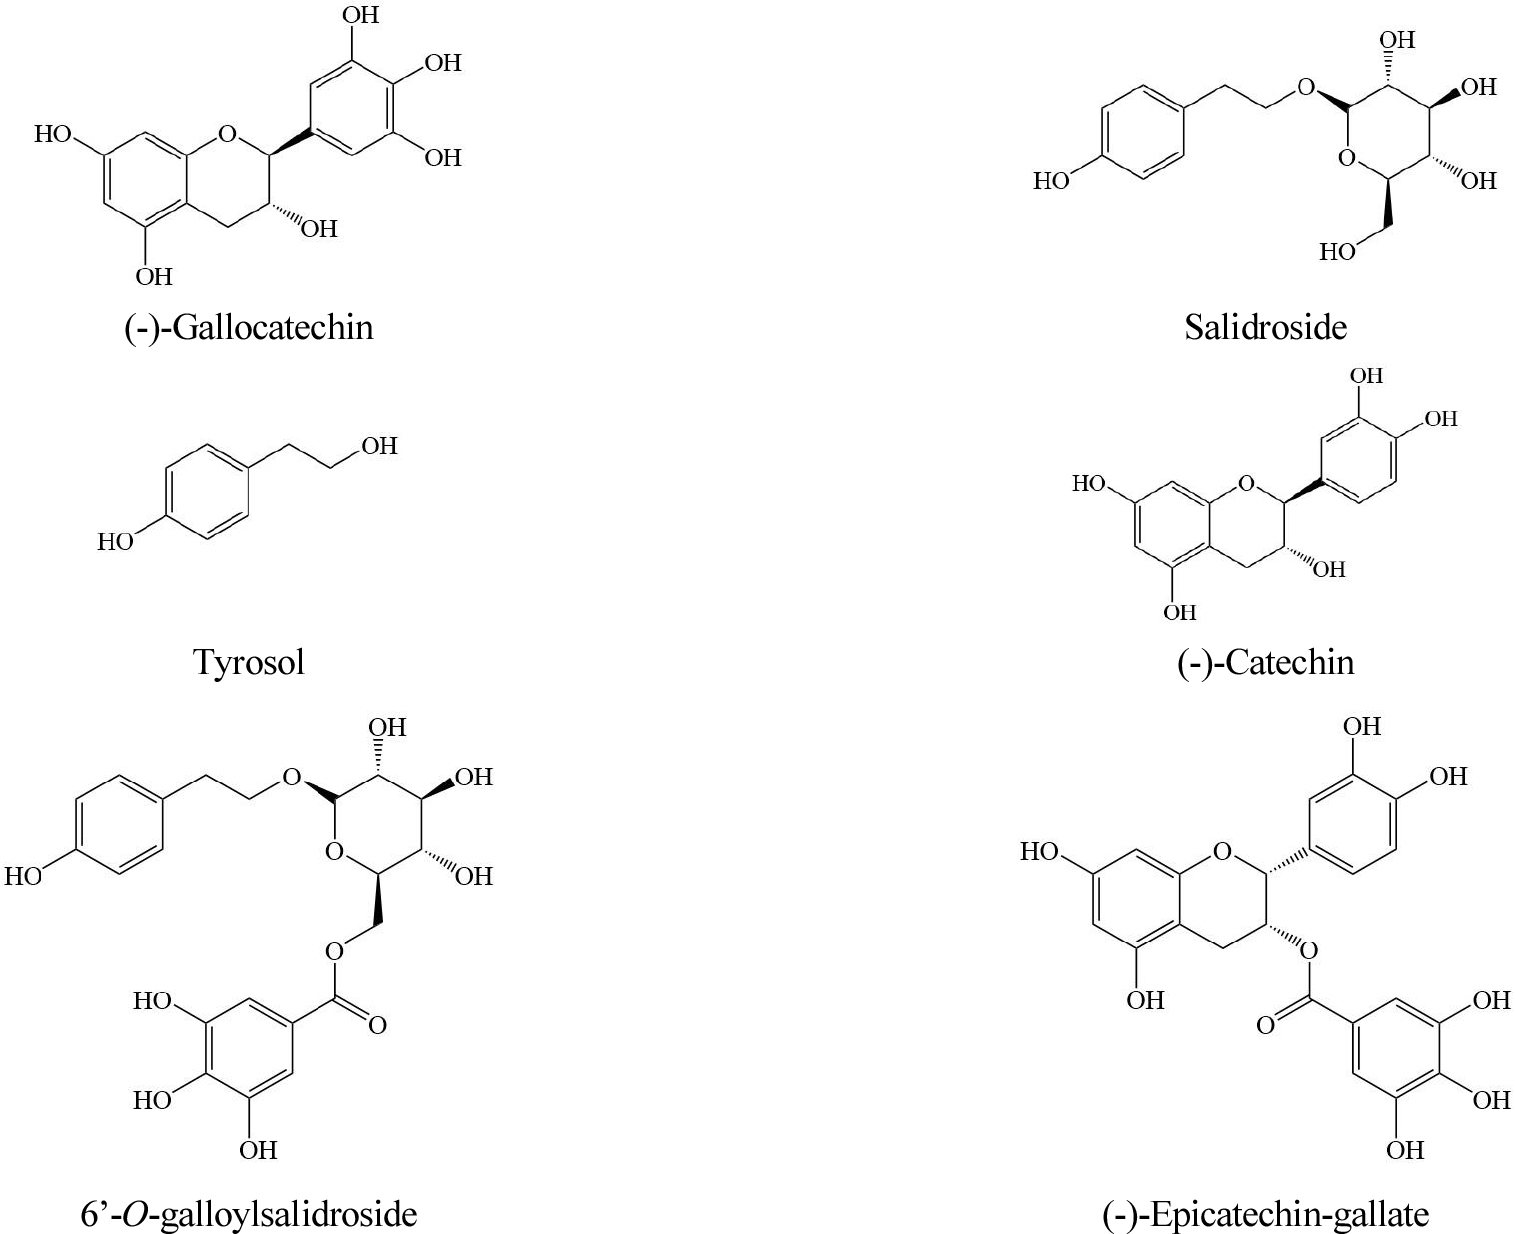
Compounds, (-)-catechin, (-)-epicatechin gallate, (-)-gallocatechin, salidroside, tyrosol and 6’-O-galloylsalidroside were separated from A. tegmentosum using MPLC, prep-HPLC and established by ESI-MS, 1D and 2D NMR data including HSQC and HMBC based on the protocol mentioned earlier (NIoFS, 2020; Fig. 2). HPLC-grade methanol, ethanol, acetonitrile, distilled water were purchased from J.T. Baker (PA, USA).
Sample and standard preparation
The collected samples were washed with distilled water and lyophilized. After measuring the dry weight of the sample, the powder was pulverized with a grinder and passed through a 80 mesh standard sieve and finally stored at -70℃ until further analysis. A sample of the powder was extracted with 100 ㎖ of 70% ethanol in an ultrasonic bath (JAC-5020, KODO, Korea) for 60 min at room temperature. After extraction, the samples were centrifuged (Labogene, BMS, Korea) at 3000 rpm for 5 min, and the supernatant was separated. The supernatant was filtered by 0.45 ㎛ membrane filter (Whatman co., Maidstone, UK).
Standards working solutions for HPLC were prepared by diluting the stock solutions in methanol to obtain concentration ranges of 31 - 500 ㎍/mL for six compounds.
Apparatus and analytical conditions
Data were obtained using a Waters alliance HPLC (Waters co., MA, USA) with a UV detector. The analytical conditions for recording chromatograms of the six compounds were as follows: Qualitative and quantitative analysis was carried out using an YMC Tariart-C18 column (4.6 × 250 ㎜, 5 ㎛, YMC co. ltd., Japan) with the column oven at 30℃. The mobile phase was a binary eluent of water with 0.05% trifluoroacetic acid (A) and acetonitrile (B) with gradient conditions as follows: Initial - 10 min, 5% B; 10 - 70 min, 23% B; 70 - 75 min, 100% B; 75 - 85 min, 100% B; injection volume of 10 µL, flow rate of 1.0 mL/min and detection wavelength of 225 ㎚. Each sample was analyzed in least triplicate and expressed as a mean value.
Method validation
The HPLC method was validated for linearity, limit of detection (LOD), limit of quantification (LOQ), accuracy and precision. Calibration curves were constructed with five different concentrations by using the following concentration ranges: 31 - 500 ㎍/mL for six compounds. LOD and LOQ under the present chromatographic conditions were determined at a signal-to-noise ratio of 3.3 and 10, respectively. The i ntra- and inter-day precision (coefficient of variation [CV]) and accuracy (%) were determined by analyzing three replicates of three different concentrations within 1 day or 3 sequential days. Precision and accuracy were examined within the linear range of the standard curves that were redefined in each analytical run. The intra- and inter-day precision was expressed as the relative standard deviation (CV). Intra- and inter-day accuracy was expressed as the observed concentration value relative to the true concentration value. Each samples were analyzed in triplicates at three different concentrations and expressed as a mean value.
Determination of soil-chemical properties
Soil samples were collected from 19 different cultivation regions of A. tegmentosum in 3 replicates. Surface soil was removed and soil was collected at a depth within 20 ㎝. Soil physicochemical properties were analyzed according to standard protocols designed by RDA (Rural Development Administration, 2017). Soil texture of the sampled soil was confirmed using soil classification triangular chart given by the USDA (U.S. Department of Agriculture) with the ratio of sand, silt and clay measured using the pipette method. Soil pH and electrical conductivity (EC) were measured by adding 10 g of dried soil to 50 mL of distilled water and subsequently using a pH meter and an EC meter, respectively. The soil organic matter (OM) content was measured using the Tyurin method and the total nitrogen (TN) content was measured by the Kjeldahl sulfuric acid distillation method. Available phosphate (Avail. P2O5) was measured by molybdenum blue method using 1-amino-2-naphthol-4-sulfonic acid solution. After leaching dried soil sample in 1N NH4OAc (pH7.0), the exchangeable cation was measured using an inductively coupled plasma- optical emission spectrometry (ICP-OES) and the cation exchange capacity (CEC) of the exchanged ammonium was measured by Kjeldahl distillation method. Each sample was analyzed in triplicates and expressed as a mean value.
Statistical and multivariate analysis
Data are expressed as means±standard deviation (S.D.). Statistical analysis was performed using the language R 4.1.0 (R development Core Team, New Zealand). The correlation between soil parameters and bioactive compounds of A. tegmentosum was confirmed by Pearson’s correlation coefficient.
Results and Discussion
HPLC-UV method validation
HPLC method was validated for linearity, LOD, LOQ, accuracy and precision. Linearity was examined with five different concentrations of the six bioactive compounds using calibration curves from the linear regression analysis. The bioactive compounds showed good linearity (r2 > 0.9996) within the tested range and LOD and LOQ values ranged from 0.21 to 1.65 ㎎/mL and 0.70 to 5.10 ㎎/mL, respectively (Table 1). Intra- and inter-day variations were selected to determine the precision and accuracy of the method. Precision values ranged from 0.14 to 1.50% and 0.13 to 1.15%, respectively and accuracy values ranged from 90.31 to 106.96% and 90.84 to 106.96%, respectively. As shown in Table 2, the overall precision and accuracy values were within acceptable ranges. The average recoveries of the six bioactive compounds were satisfactory, as all values were from 90.8 to 107.0% (data not shown).
Table 1.
Linear regression, LOD, LOQ of six bioactive compounds
Table 2.
Intra-, Inter-day precision and accuracy of six bioactive compounds
Quantitative analysis of bioactive compounds
The HPLC-UV method was applied to the 57 samples of A. tegmentosum. The six bioactive compounds were identified by comparing retention time and UV spectra chromatograms of the peaks with those of the standards in HPLC-UV chromatogram (Fig. 3). The analysis was performed in triplicate and the results are expressed as mean (Table 3).
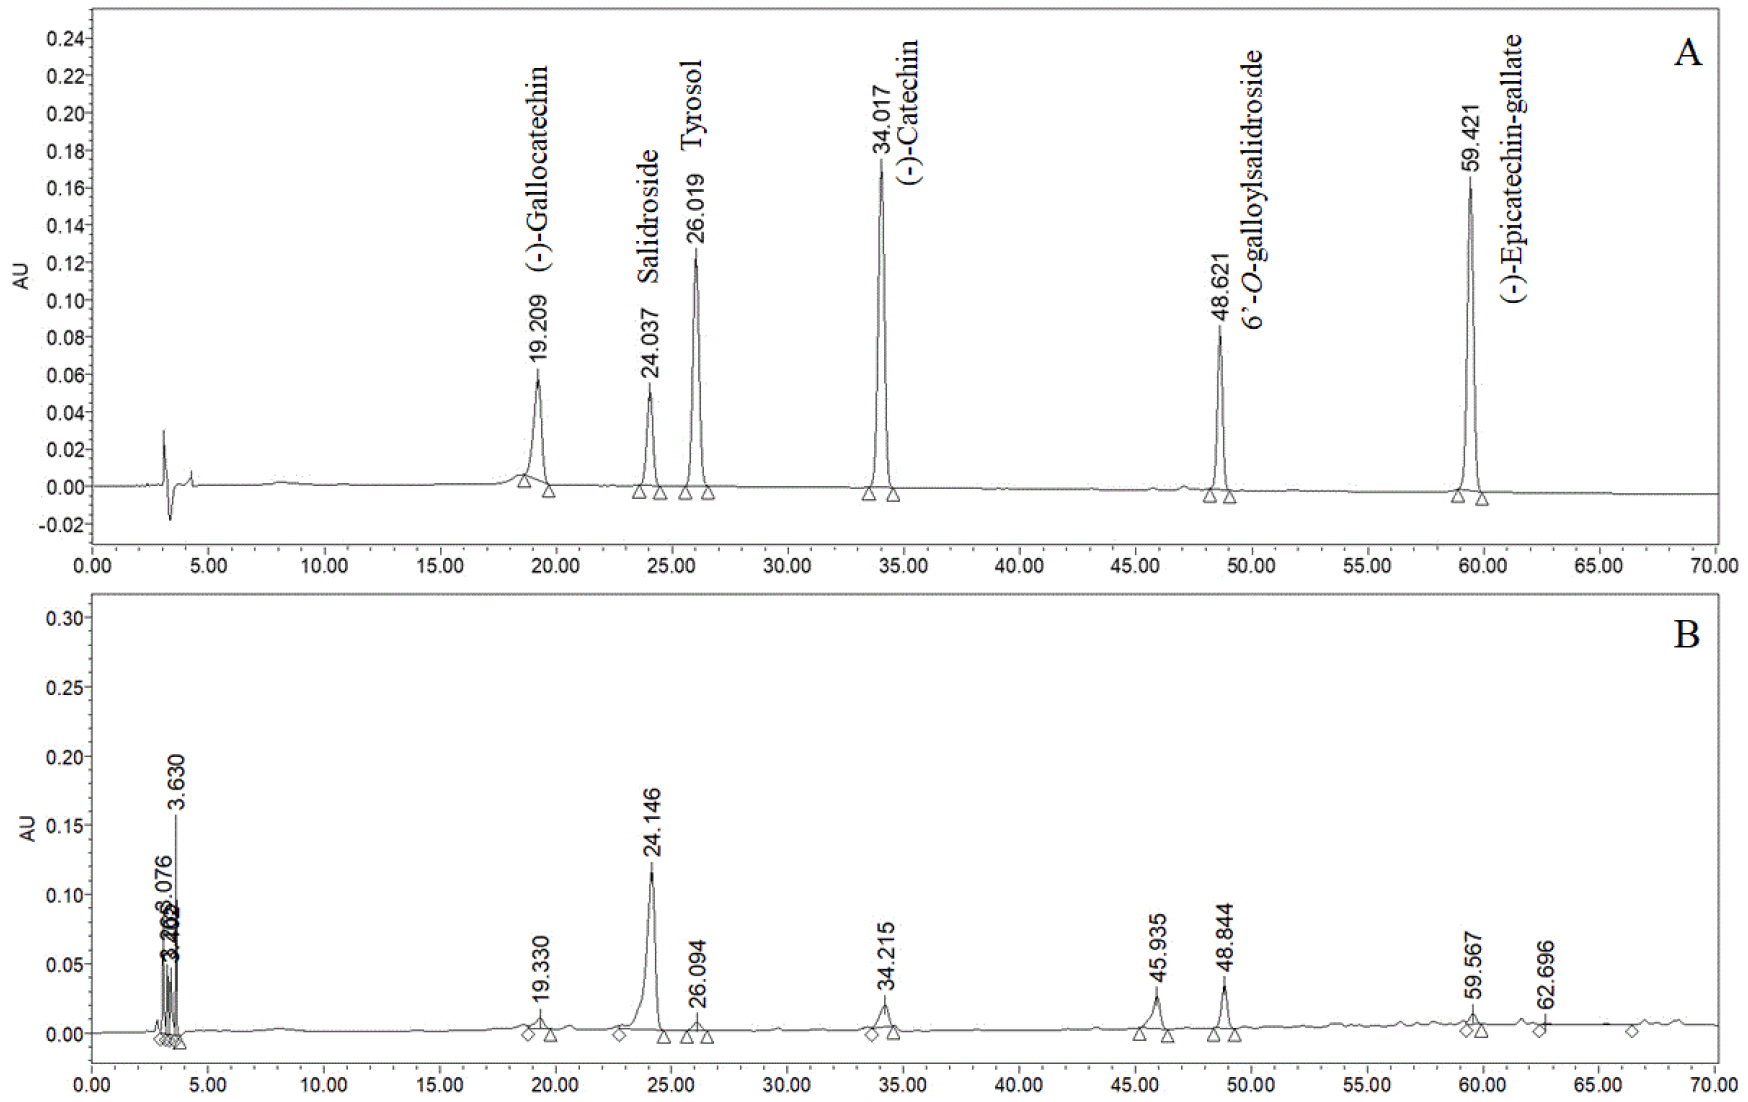
Table 3.
Six bioactive compound composition of Acer tegmentosum in 19 different cultivation regions
| Cultivation fields | Contents (%) | |||||
| (-)-Gallocatechin | Salidroside | Tyrosol | (-)-Catechin | 6’-O-Galloylsalidroside | (-)-Epicatechin-gallate | |
| 1 | 0.06±0.03 | 1.15±0.26 |
NDZ | 0.05±0.01 | 0.11±0.02 | ND |
| 2 | 0.040±0.01 | 0.90±0.06 | ND | 0.06±0.02 | 0.02±0.01 | ND |
| 3 | 0.17±0.06 | 1.99±0.62 | ND | 0.15±0.03 | 0.14±0.05 | 0.01±0.00 |
| 4 | 0.43±0.28 | 2.79±1.12 | ND | 0.37±0.14 | 0.28±0.02 | 0.04±0.02 |
| 5 | 0.24±0.09 | 2.42±0.97 | 0.43±0.00 | 0.19±0.05 | 0.17±0.12 | 0.03±0.03 |
| 6 | 0.37±0.13 | 2.56±0.73 | 0.09±0.00 | 0.26±0.04 | 0.31±0.06 | 0.03±0.01 |
| 7 | 0.25±0.10 | 2.07±0.31 | ND | 0.15±0.04 | 0.08±0.01 | 0.02±0.03 |
| 8 | 0.28±0.12 | 1.76±0.14 | ND | 0.19±0.03 | 0.08±0.03 | 0.01±0.01 |
| 9 | 0.34±0.04 | 2.51±0.41 | ND | 0.29±0.04 | 0.17±0.04 | 0.04±0.01 |
| 10 | 0.13±0.14 | 2.11±0.51 | 0.03±0.00 | 0.13±0.06 | 0.15±0.08 | 0.02±0.03 |
| 11 | 0.33 ±0.07 | 3.08±0.11 | ND | 0.26±0.02 | 0.15±0.06 | 0.03±0.01 |
| 12 | 0.22±0.06 | 1.93±0.27 | ND | 0.19±0.02 | 0.14±0.06 | 0.01±0.01 |
| 13 | 0.30 ±0.12 | 2.40±0.27 | ND | 0.20±0.01 | 0.19±0.01 | 0.02±0.00 |
| 14 | 0.07±0.02 | 1.57±0.10 | ND | 0.13±0.03 | 0.07±0.01 | 0.02±0.02 |
| 15 | 0.28±0.05 | 3.42±0.32 | ND | 0.25±0.03 | 0.14±0.06 | 0.02±0.01 |
| 16 | 0.32±0.04 | 3.26±0.15 | ND | 0.16±0.05 | 0.11±0.03 | 0.01±0.00 |
| 17 | 0.40±0.08 | 3.43±0.38 | ND | 0.27±0.03 | 0.08±0.04 | 0.03±0.03 |
| 18 | 0.41±0.08 | 3.29±0.02 | ND | 0.15±0.07 | 0.08±0.03 | 0.02±0.02 |
| 19 | 0.34±0.06 | 3.86±0.59 | 0.24±0.00 | 0.15±0.10 | 0.12±0.11 | 0.01±0.01 |
The samples contained (-)-gallocatechin from 0.04 to 0.43%, salidroside from 0.90 to 3.86%, tyrosol from 0.03 to 0.43%, (-)-catechin from 0.05 to 0.37%, 6’-O-galloylsalidroside from 0.02 to 0.31%, (-)-epicatechin-gallate from 0.01 to 0.04%. Among the six compounds, salidroside was present in the highest composition. (-)-Gallocatechin, salidroside, (-)-catechin and 6’-O-galloylsalidroside were commonly present in all cultivation regions, while tyrosol and (-)-epicatechin-gallate were not. According to the simultaneous analysis based on the three aerial parts of A. tegmentosum, it was reported that salidroside was mainly distributed (Lee et al., 2017). This study also confirmed that the result was consistent with previous study because on the high content of salidroside.
Soil properties
The soil physico-chemical properties of 19 different cultivation regions of A. tegmentosum are showed in Table 4. Soil samples were classified as sandy loam according to the soil texture. Soil pH ranged from 4.37 to 6.20, and was identified to be slightly acidic, except for some areas. EC was determined ranging from 0.02 to 0.18 dS/m, OM was 0.37 ~ 12.15%, TN was 0.04 ~ 0.56%, Avail. P2O5 was 7.97 ~ 796.46 ㎎/㎏ and CEC was 7.95 ~ 30.05 cmol+/㎏. In addition, exchangeable cation (K+- 0.09 ~ 0.60, Ca2+- 0.41 ~ 15.87, Mg2+- 0.20 ~ 3.82, Na+- 0.03 ~ 0.08 cmol+/㎏) was also identified. Soil properties affect to growth of plant (Khalil et al., 2015). pH promotes decomposition of organic matter, increase the aggregation form of soil particle, increase the adsorption of minerals. Exchangeable cation has positive correlation with organic matter. Salinity affects plant growth. It inhibits the growth of young plants or accelerates the aging of mature plants.
Table 4.
Soil physico-chemical properties of Acer tegmentosum in 19 different cultivation regions
|
Cultivation fields |
Soil texture | pH | ECz | OMy | TNx | Avail. P2O5w | Exchangeable cation | CECv | |||
| K+ | Ca2+ | Mg2+ | Na+ | ||||||||
| (1:5) | (dS/m) | (%) | (%) | (mg/kg) | ---------------------(cmol+/kg)------------------ | (cmol+/kg) | |||||
| 1 |
Sandy loam | 7.20±0.16 | 0.10±0.02 | 3.62±0.71 | 0.20±0.06 | 246.25±53.36 | 0.60±0.25 | 8.75±0.32 | 2.73±0.19 | 0.03±0.01 | 16.73±1.06 |
| 2 |
Sandy loam | 6.82±0.07 | 0.18±0.07 | 8.88±3.13 | 0.42±0.12 | 57.60±24.75 | 0.34±0.17 | 15.87±2.81 | 3.82±1.91 | 0.03±0.00 | 24.33±6.35 |
| 3 |
Sandy loam | 6.06±0.17 | 0.09±0.01 | 8.51 ±1.05 | 0.41±0.04 | 298.04±70.18 | 0.24±0.03 | 11.75±1.99 | 1.11±0.31 | 0.04±0.01 | 23.05±3.89 |
| 4 |
Sandy loam | 5.52±0.17 | 0.10±0.04 | 12.15±5.84 | 0.56±0.21 | 169.20±39.34 | 0.52±0.40 | 9.55±5.90 | 1.12±0.74 | 0.04±0.01 | 30.05±11.9 |
| 5 |
Sandy loam | 4.65±0.40 | 0.05±0.01 | 3.39±0.83 | 0.18±0.05 | 117.85±65.41 | 0.10±0.02 | 0.71±0.31 | 0.25±0.16 | 0.04±0.01 | 15.02±1.65 |
| 6 |
Sandy loam | 4.51±0.06 | 0.10±0.01 | 6.21±0.69 | 0.33±0.05 | 505.94±51.52 | 0.30±0.04 | 4.21±1.36 | 0.84±0.27 | 0.04±0.01 | 18.46±2.07 |
| 7 |
Sandy loam | 4.43±0.32 | 0.06±0.01 | 2.97±0.63 | 0.16±0.04 | 397.88±60.94 | 0.18±0.02 | 1.31±1.10 | 0.58±0.31 | 0.03±0.01 | 14.35±2.69 |
| 8 |
Sandy loam | 5.78±0.35 | 0.09±0.02 | 2.03±0.28 | 0.13±0.03 | 251.21±40.20 | 0.36±0.04 | 4.43±0.40 | 0.88±0.06 | 0.03±0.00 | 13.89±1.50 |
| 9 |
Sandy loam | 4.89±0.18 | 0.09±0.02 | 5.76±0.62 | 0.29±0.03 | 164.97±14.65 | 0.17±0.03 | 3.97±0.85 | 0.64±0.05 | 0.03±0.01 | 17.55±0.86 |
| 10 |
Sandy loam | 5.28±0.26 | 0.04±0.01 | 2.84±0.27 | 0.18±0.01 | 172.66±47.81 | 0.26±0.09 | 2.15±0.83 | 0.47±0.25 | 0.03±0.00 | 15.60±0.75 |
| 11 |
Sandy loam | 6.20±0.36 | 0.09±0.01 | 4.41±0.60 | 0.23±0.05 | 302.46±94.03 | 0.31±0.02 | 7.65±0.19 | 2.00±0.43 | 0.03±0.01 | 16.86±0.84 |
| 12 |
Sandy loam | 4.86±0.55 | 0.10±0.04 | 4.51 ±1.06 | 0.25±0.06 | 268.90±139.6 | 0.40±0.39 | 4.52±4.73 | 0.90±0.64 | 0.03±0.01 | 16.48±1.32 |
| 13 |
Sandy loam | 5.10±0.20 | 0.06±0.02 | 2.79 ±1.28 | 0.18±0.06 | 572.49±158.3 | 0.22±0.03 | 3.79±1.30 | 1.03±0.44 | 0.04±0.01 | 15.33±1.14 |
| 14 |
Sandy loam | 4.87±0.19 | 0.09±0.02 | 4.30±0.91 | 0.23±0.05 | 328.69±24.80 | 0.32±0.08 | 2.19±1.02 | 0.89±0.41 | 0.05±0.01 | 15.91±1.41 |
| 15 |
Sandy loam | 5.84±0.29 | 0.08±0.03 | 3.03±0.49 | 0.19±0.02 | 224.07±4.37 | 0.24±0.02 | 6.39±0.75 | 1.17±0.28 | 0.08±0.01 | 16.45±0.48 |
| 16 |
Sandy loam | 4.62±0.18 | 0.02±0.00 | 0.37±0.09 | 0.04±0.01 | 7.97±3.38 | 0.13±0.01 | 0.41±0.03 | 1.29±0.24 | 0.03±0.01 | 7.95±0.99 |
| 17 |
Sandy loam | 4.70±0.12 | 0.03±0.01 | 0.55±0.14 | 0.07±0.02 | 81.16±25.46 | 0.09±0.01 | 4.78±0.08 | 0.20±0.02 | 0.06±0.01 | 8.98±0.21 |
| 18 |
Sandy loam | 4.37±0.22 | 0.14±0.03 | 3.10±0.62 | 0.18±0.03 | 543.02±51.34 | 0.55±0.20 | 2.09±0.20 | 0.56±0.20 | 0.04±0.01 | 15.92±0.36 |
| 19 |
Sandy loam | 5.58±0.20 | 0.07±0.03 | 4.48±0.27 | 0.21±0.01 | 796.46±58.29 | 0.17±0.03 | 4.78±0.65 | 0.74±0.16 | 0.05±0.01 | 16.98±0.38 |
Correlation between soil properties and bioactive compounds of A. tegmentosum
The results of correlation analysis between soil properties and six bioactive compounds of A. tegmentosum are presented in table 5. (-)-Gallocatechin, salidroside and (-)-catechin that are commonly present in all samples had showed significant negative correlation with pH, magnesium (Mg2+). Among the soil properties, pH is correlated with (-)-gallocatechin (r = -0.369, p < 0.01), salidroside (r = -0.369, p < 0.01), (-)-catechin (r = -0.308, p < 0.05) and (-)-epicatechin-gallate (r = -0.264, p < 0.05), and exchangeable Mg2+ is correlated (-)-gallocatechin (r = -0.279, p < 0.05), salidroside (r = -0.411, p < 0.01) and (-)-catechin (r = -0.290, p < 0.05). On the other hand, Available phosphate had shown positive correlation with (-)-gallocatechin (r = 0.282, p < 0.05), salidroside (r = 0.326, p < 0.05) and tyrosol (r = 0.370, p < 0.01). Also, it was confirmed that salidroside was significantly affected by exchangeable Ca2+(r = -0.352, p < 0.01), Na+ (r = 0.311, p < 0.05).
Table 5.
Pearson’s correlation coefficient between soil chemical properties and bioactive compounds of Acer tegmentosum
| Compound name | Correlation coefficient (r)z | ||||||||||
| pH | ECy | OMx | TNw | Avail. P2O5v | Exchangeable cation | CECu | |||||
| K+ | Ca2+ | Mg2+ | Na+ | ||||||||
| (1:5) | (dS/m) | (%) | (%) | (㎎/㎏) | ---------------------(cmol+/㎏)------------------ | (cmol+/㎏) | |||||
| (-)-Gallocatechin |
-0.369** (0.005) |
0.031 (0.820) |
0.050 (0.713) |
0.045 (0.742) |
0.282* (0.034) |
0.157 (0.244) |
-0.205 (0.127) |
-0.279* (0.035) |
0.030 (0.826) |
0.015 (0.912) | |
| Salidroside |
-0.447** (0.001) |
-0.214 (0.110) |
-0.196 (0.143) |
-0.221 (0.098) |
0.326* (0.013) |
-0.194 (0.148) |
-0.352** (0.007) |
-0.411** (0.001) |
0.311* (0.019) |
-0.202 (0.133) | |
| Tyrosol |
-0.014 (0.918) |
-0.017 (0.901) |
0.026 (0.846) |
0.006 (0.963) |
0.370** (0.005) |
-0.098 (0.466) |
-0.022 (0.873) |
-0.091 (0.500) |
0.160 (0.235) |
0.007 (0.960) | |
| (-)-Catechin |
-0.308* (0.020) |
-0.094 (0.485) |
0.202 (0.133) |
0.206 (0.124) |
0.077 (0.571) |
0.015 (0.910) |
-0.118 (0.381) |
-0.290* (0.029) |
0.082 (0.546) |
0.174 (0.197) | |
| 6’-O-Galloylsalidroside |
-0.141 (0.296) |
0.019 (0.886) |
0.203 (0.130) |
0.259 (0.052) |
0.183 (0.174) |
0.099 (0.462) |
-0.053 (0.695) |
-0.043 (0.751) |
-0.117 (0.387) |
0.221 (0.098) | |
| (-)-Epicatechin-gallate |
-0.264* (0.047) |
-0.093 (0.493) |
0.149 (0.268) |
0.142 (0.291) |
0.165 (0.219) |
0.020 (0.881) |
-0.151 (0.261) |
-0.203 (0.130) |
-0.076 (0.574) |
0.164 (0.224) | |
Salidroside, main compound of A. tegmentosum is affected pH, exchangeable cation (Mg2+,Ca2+ and Na+) and available phosphate. Numerous research results have been reported that the pH value and exchangeable cations the soil affects the growth of plants and production of secondary metabolite (Kandimalla et al., 2020; Radić et al., 2016; Wink, 2008), and our result also confirmed that the pH value has the greatest correlation on the content of salidroside, the main compound. In addition, it has also been reported that available phosphate has a positive effect on the production of secondary metabolites (Setyawati et al., 2020).
Eo et al. (2020b) reported that the Mg2+ content, pH, and clay ratio had a high effect on the contents of morroniside and loganin, which are bioactive compounds of Cornus officinalis. Also, Kim et al. (2020) and Eo et al. (2021) reported the results on the correlation between growth of medicinal resources (Panax ginseng C.A. Meyer, Paeonia lactiflora Pall.) and the soil properties. Liang et al. (2021) was reported that available phosphate has a negative effect on the contents of tanshinone IIA in Salvia miltiorrhiza. Also, Tanshinone IIA was related to temperature, but salvianolic acid B was not. In addition, they said that these results are related to the biosynthetic pathway through which the synthesis of compounds takes place. Moreover, they said that these findings might provide helpful references for quality control of S. miltiorrhiza.
Since out current study analyzed only the correlation between soil properties and the contents of compounds, it is necessary to study the relationship with plant growth and biosynthetic pathways through future researches.
