

Introduction
Materials and Methods
Chemicals and reagents
Plant materials, cultivation and classification
Extraction and analysis of anthocyanins
Statistical analysis
Results
General
Variation of yield components
Variations of anthocyanin contents
Principal component and correlation analysis
Discussion
Introduction
Soybean (Glycine max (L.) Merrill), a species in the Leguminosae family, has been known for a long time as a traditional food in Asia (Li et al., 2013). Soybean seeds are found in various forms of seed coat colors, and studies verified that differences in the level of pigment-stimulating metabolites cause such color variations (Song et al., 2016). Several health- promoting metabolites such as anthocyanins, isoflavones, protein, and fatty acids are ubiquitous in soybeans. Furthermore, different studies asserted that the consumption of soybean and soy products is associated with reduced risks of renal and cardiovascular diseases, cancer, and even aging (Ganesan and Xu, 2017; Yamashita et al., 2020; Zhou et al., 2017). In another aspect, the oil content in soybean has made it to become one of the major feedstocks in the production of biodiesel (Graef et al., 2009). Owing to these, the production, intake, and demand of soybean, in general, are increasing globally. Currently, Brazil is the leading soybean producer worldwide followed by the United States and Argentina (FAO, 2019).
It is a global phenomenon that unfavorable weather conditions triggered by climate change are challenging the cultivation of high-quality soybeans (Battisti et al., 2017). Associated with this, developing soybean cultivars that provide high yield has become one of the top objectives of many breeders (Kang et al., 2021; Li et al., 2017; Wang et al., 2015). Several studies already identified many functional genes that control yield components in soybeans and hence, traits associated with yield components are important targets during breeding (Bianchi et al., 2020; Carciochi et al., 2019). In addition to the differences in genetic makeup, several studies outlined the effects of environmental factors including temperature, farming condition, year of cultivation, growing location and solar radiation on yield components (Carciochi et al., 2019; Sobko et al., 2020). Equally, the metabolite contents of soybeans are highly influenced by both genetic and environmental factors. Black soybeans, characterized by black seed coat color, are known for the accumulation of high levels of anthocyanins in their seed coats. In general, the glycoside derivatives of three anthocyanins including cyanidin, delphinidin, and petunidin are commonly reported in black soybeans. Other anthocyanins including the different glycoside derivatives of peonidin, malvidin and pelargonidin have also been reported, but are considered as minor components (Cho et al., 2013; Lee et al., 2017). Overall, investigating the influences of environmental and genetic factors on yield components and metabolite contents provides useful information to breeders and hence, is constantly desired. Besides, such studies are applied to examine a large population of genetic resources and pinpoint genotypes possessing desirable characteristics (Li et al., 2017; Seo et al., 2020; Sobko et al., 2020).
In Korea, black soybean varieties are identified based on their seed size (Kim et al., 2012). Locally, small size soybeans are known as Yakkong while large size soybeans are known as Soritae (Hwang et al., 2012; Lee et al., 2014). There is also a growing interest and attention towards developing improved soybean cultivars for local use. In this regard, the effects of some environmental and genetic factors on the various agronomical properties as well as metabolite contents in black soybeans have been previously investigated (Hong et al., 2010; Kim et al., 2005; Kim et al., 2012). However, studies that assessed the yield components and metabolite contents in large populations of Soritae and Yakkong landraces are still limited. In this study, we cultivated 115 Soritae and 86 Yakkong black soybean local landraces collected from ten different locations in Korea and investigated the variations of three yield components (seeds weight, number of seeds per pod, and yield per plant) and three anthocyanins (cyanidin- 3-O-glucoside (C-3-O-G), deliphindin-3-O-glucoside (D-3-O-G) and petunidin-3-O-glucoside (Pt-3-O-G)) with regard to landrace type and collection area.
Materials and Methods
Chemicals and reagents
All the chemicals and reagents used in this study were analytical grade (purity > 98%). Anthocyanin reference standards of C-3-O-G and D-3-O-G were purchased from Caymanchem (Ann Arbor, MI, USA), whereas Pt-3-O-G was obtained from Carbosynth (Berkshire, UK). The other chemicals and solvents including hydrochloric acid, formic acid, water and acetonitrile were purchased from Sigma Aldrich (St.Louis, MO, USA).
Plant materials, cultivation and classification
Seeds of Soritae (n = 115) and Yakkong (n = 86) black soybean landraces were obtained from the Gene bank of the National Agrobiodiversity Center, Rural Development Administration (RDA, Jeonju, Korea). Cultivation of the seeds was conducted between June and October of 2018 in an experimental field located at the center (latitude/longitude: 35o49´38.37´´N/127o 09´07.78´´E) according to our recently reported protocol (Choi et al., 2021). For each landrace, a total of 14 seeds in seven replicates were sown at a spacing of 15 cm in a row, and the rows were 90 cm apart. During the cultivation period, the average monthly temperature was recorded to be 23.1℃ in June, 27.8℃ in july, 28.6℃ in August, 21.7℃ in September, and 13.9℃ in October. Moreoever, the average monthly precipitation was 137.2, 169.1, 368.9, 101.8, and 123.2 ㎜ in June, July, August, September, and October, respectively. Matured seeds were hand-harvested and yield components including one-hundred seeds weight (HSW), seeds per pod (SPP) and yield per plant (YPP) were recorded from field examination and laboratory inspection. The soybeans were also grouped according to their collection area as Chungcheongbuk-do (n = 21), Chungcheongnam-do (n = 13), Gyeonggi-do (n = 16), Gyeongsangbuk-do (n = 13), Gyeongsangnam-do (n = 54), Gangwon-do (n = 36), Incheon (n = 10), Jeju-do (n = 12), Jeollabuk-do (n = 10), and Jeollanam-do (n = 16) (Table 1). Seed coat samples from each category were lyophilized in an LP500 freeze drier (ilShinBioBase, Dongducheon, Korea), powdered and readied for anthocyanin analysis.
Table 1.
Number of soybean landraces and one-hundred seeds weight according to collection area
| Collection Area | Soritae | Yakkong | |||||
| nz | HSWy (g) | n | HSW (g) | ||||
| Range | Mean | Range | Mean | ||||
| Chungcheongbuk-do | 15 | 25.37-35.57 | 31.57bcx | 5 | 9.83-12.00 | 10.71b | |
| Chungcheongnam-do | 10 | 25.47-37.47 | 32.94bc | 4 | 10.20-12.63 | 11.13ab | |
| Gyeonggi-do | 6 | 30.37-35.73 | 33.04bc | 10 | 10.30-14.70 | 12.47a | |
| Gyeongsangbuk-do | 3 | 28.57-35.63 | 31.64bc | 10 | 10.80-13.00 | 11.69ab | |
| Gyeongsangnam-do | 45 | 25.00-36.37 | 31.04c | 9 | 10.10-12.53 | 11.33ab | |
| Gangwon-do | 17 | 27.83-36.27 | 31.78bc | 19 | 6.03-14.13 | 11.76ab | |
| Incheon | 5 | 29.13-36.33 | 32.71bc | 5 | 9.83-12.57 | 11.43ab | |
| Jeju-do | 6 | 32.33-37.47 | 34.30ab | 6 | 10.60-12.53 | 11.12ab | |
| Jeollabuk-do | 3 | 36.07-41.10 | 38.08a | 7 | 10.60-12.40 | 11.49ab | |
| Jeollanam-do | 5 | 28.27-34.93 | 33.00bc | 11 | 8.87-14.83 | 11.78ab | |
| Total | 115 | 25.00-41.10 | 32.02 | 86 | 6.03-14.83 | 11.61 | |
Extraction and analysis of anthocyanins
Extraction and analysis of anthocyanins were performed according to our recently reported method (Choi et al., 2021). In brief, 0.2 g of powdered soybean seed coat sample was mixed with 30 mL of 80% methanol containing 1% HCl in a 50 mL extraction tube, sonicated for 10 min, and hydrolyzed in a water bath for 20 min. The mixture was then incubated at 65℃ with instant shaking (280 rpm) and cooled in an ice bath for 15 min followed by centrifugation for 4 min at 1000 rpm. Finally, the upper supernatant was retained, filtered through a 0.45 ㎛ micro-membrane, and 20 µL of it was injected into a Nanospace SI-2 Semi-microcolumn high-performance liquid chromatography system (Shiseido, Tokyo, Japan), coupled to a UV-Vis detector and equipped with a Shiseido C18 column type MGII (4.6 × 250 ㎜; 5 ㎛). A binary solvent system composed of water (A) and acetonitrile (B) each containing 5% formic acid was used as a mobile phase with gradient conditions of 10-15%B (0-10 min) at 0.8 mL/min, 10-46%B (10-15.3 min) at 0.8 mL/min, 46-90%B (15.3-17 min) at 1 mL/min, and 90-10%B (17- 24 min) at 0.8 mL/min. During separation, the column temperature was maintained at 40℃ and anthocyanins were read at a wavelength of 520 ㎚. Identification and quantification of the target anthocyanins were conducted using the corresponding external standards.
Statistical analysis
In this study, all results were reported as mean ± standard deviation (SD) from duplicate measurements. For each soybean landrace, the total anthocyanin content (TAC) was regarded as the sum of the three target anthocyanins. One-way analysis of variance was conducted to see the variation between measurements, and the level of significancewas estimated at p < 0.05. Principal component analysis (PCA) was computed using R-software Ver. 4.0.2 and applied to view the distribution of the soybean landraces and identify variables most responsible for the observed variation. Likewise, Pearson's correlation analysis was determined to evaluate the pair-wise relationship between variables.
Results
General
In this study, a total of 115 Soritae and 86 Yakkong black soybean landraces of Korean origin were cultivated and three key yield components including HSW, SPP and YPP, and three major anthocyanins including C-3-O-G, D-3-O-G, and Pt-3-O-G were analyzed. Seed weight was measured as the mean mass per 100 seeds and expressed as HSW. Likewise, the SPP was determined as the total number of seeds found in a pod, whereas the YPP was determined as the weight of the total number of seeds produced in a soybean landrace. On the other hand, the target anthocyanins were identified and quantified by HPLC using the corresponding external standards. The variations of each of the yield components and anthocyanin contents were assessed according to landrace type and collection area as described below. Supplementary Table S1 presents the list of landraces, introduction number, collection area, and the average values of each of the analyzed yield components and anthocyanins for all the 201 black soybeans. Other qualitative and quantitative agronomical properties of the soybean landraces recorded during the cultivation period are provided in Supplementary Table S2.
Variation of yield components
The soybeans showed wide variations in all three yield components (Supplementary Table S1). The HSW was in the ranges of 25.00-41.10 and 6.03-14.83 g for Soritae and Yakkong landraces, respectively (Table 1). The average HSW of Soritae landraces (32.02 g) was nearly three-fold higher than the average HSW of Yakkong landraces (11.61 g) (p < 0.05) (Fig. 1A). Concerning collection areas, Soritae landraces of Jeollabuk-do origin had the highest average HSW (38.08 g) and this value was significantly different from the other collection areas except for Jeju-do (34.30 g) (p < 0.05) (Table 1). Among Yakkong landraces, the highest average HSW was found in Gyeonggi-do landraces (12.47 g) and this value was significantly different from the lowest average HSW obtained in Chungcheongbuk-do landraces (10.71 g) (p < 0.05). Except for these, the other collection areas did not show a significant variation of HSW for a similar landrace type. Concerning SPP, Yakkong and Soritae landraces showed comparable values. The SPP was in the ranges of 2.10-2.80 in Yakkong and 2.00-2.70 in Soritae landraces. Besides, the YPP was in the ranges of 50.30-258.90 g and 37.10-235.20 g in Yakkong and Soritae landraces, respectively (Table 2). Yakkong landraces displayed higher average SPP and YPP compared to Soritae landraces, the former being significantly different (p < 0.05) (Fig. 1B, C). The variation of SPP and YPP between landraces of different origins was also assessed (Table 2). Among Soritae landraces, those collected from Gangwon-do had the highest average SPP (2.28) while those collected from Jeollabuk-do had the lowest average SPP (2.07). In terms of YPP, Soritae landraces collected from Gyeongsangbuk-do had the highest average YPP (159.27 g) while those from Chungcheongnam-do had the lowest average YPP (122.84 g). Despite such variations, statistical analysis did not show significant variations in SPP as well as YPP among Soritae landraces of different origins (p < 0.05) (Table 2). Unlike Soritae landraces, some variations were observed among Yakkong landraces of different origins with regard to SPP and YPP. Yakkong landraces collected from Jeollanam-do had the highest average SPP (2.48) and this value was significantly different from landraces of Chungcheongnam-do (2.30), Gyeongsangnam-do (2.30), Incheon (2.26), and Jeollabuk-do (2.30) origins (p < 0.05). Besides, the highest average YPP found in Yakkong landraces collected from Incheon (153.92 g) was significantly different from those of Chungcheonbuk-do (83.34 g) origin but not from landraces of the rest collection areas (p < 0.05)
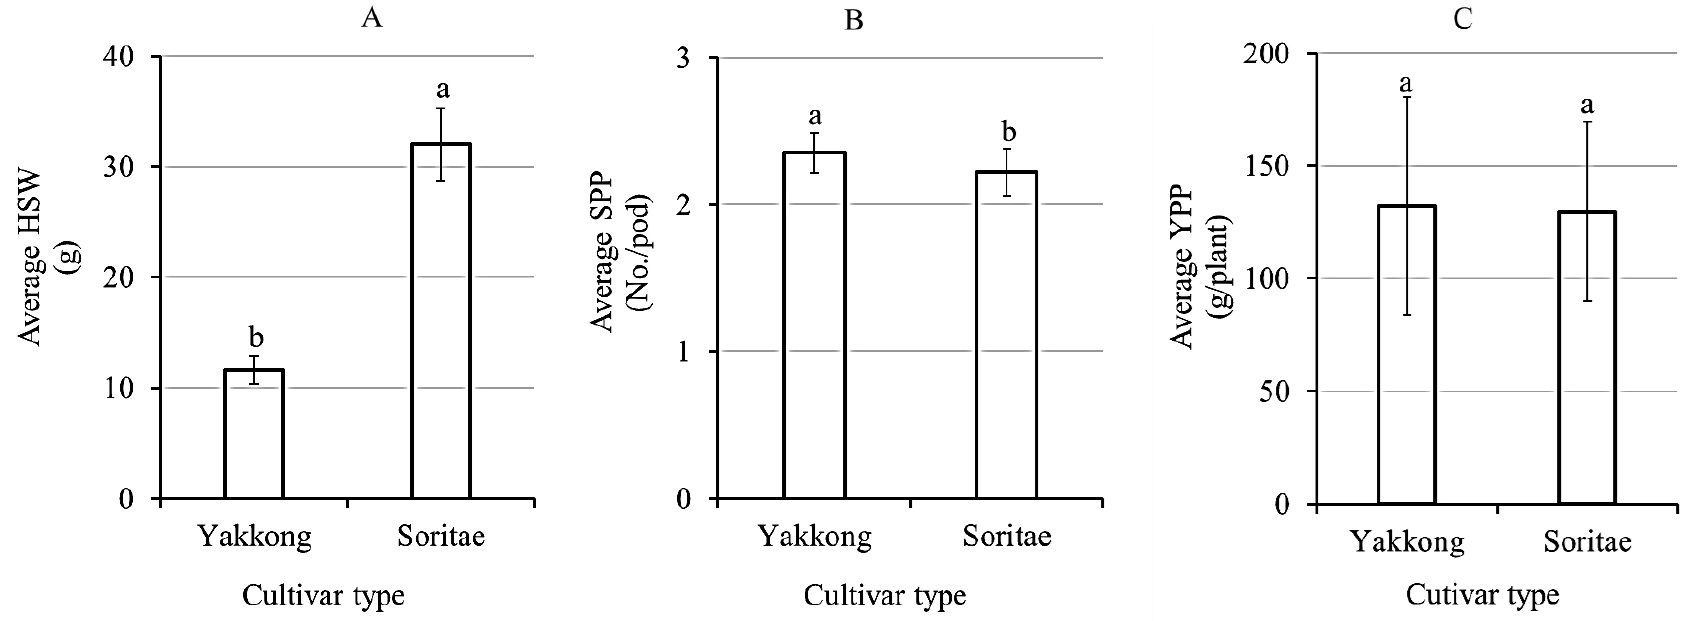
Table 2.
Yield characters of Soritae and Yakkong soybean landraces according to collection area
| Collection area | Values | SPPz (No./pod) | YPPy (g/plant) | |||
| Soritae | Yakkong | Soritae | Yakkong | |||
| Chungcheongbuk-do | Range | 2.00-2.60 | 2.20-2.60 | 37.10-235.20 | 53.40-116.70 | |
| Mean | 2.25aw | 2.36ab | 123.53a | 83.34b | ||
| CVx (%) | 8.02 | 6.43 | 40.97 | 32.82 | ||
| Chungcheongnam-do | Range | 2.10-2.40 | 2.20-2.40 | 89.00-177.50 | 92.00-190.90 | |
| Mean | 2.21a | 2.30b | 122.84a | 134.28ab | ||
| CV (%) | 4.5 | 3.55 | 27.82 | 34.07 | ||
| Gangwon-do | Range | 2.00-2.60 | 2.20-2.60 | 65.10-219.80 | 61.00-249.80 | |
| Mean | 2.28a | 2.36ab | 126.19a | 136.77ab | ||
| CV (%) | 7.47 | 5.21 | 33.51 | 35.3 | ||
| Gyeonggi-do | Range | 2.00-2.70 | 2.20-2.60 | 81.90-210.00 | 69.30-162.50 | |
| Mean | 2.25a | 2.35ab | 144.6a | 111.22ab | ||
| CV (%) | 10.42 | 5.4 | 30.75 | 32.36 | ||
| Gyeongsangbuk-do | Range | 2.10-2.40 | 2.20-2.67 | 103.00-190.20 | 70.00-258.90 | |
| Mean | 2.23a | 2.34ab | 159.27a | 142.96a | ||
| CV (%) | 6.84 | 7.29 | 30.65 | 42.18 | ||
| Gyeongsangnam-do | Range | 2.00-2.70 | 2.10-2.50 | 56.00-201.20 | 87.10-232.30 | |
| Mean | 2.21a | 2.30b | 126.9a | 152.91a | ||
| CV (%) | 7.28 | 6.15 | 28.19 | 33.13 | ||
| Incheon | Range | 2.20-2.30 | 2.20-2.30 | 92.10-202.90 | 105.30-238.80 | |
| Mean | 2.22a | 2.26b | 138.8a | 153.92a | ||
| CV (%) | 1.95 | 2.42 | 30.65 | 35.39 | ||
| Jeju-do | Range | 2.00-2.30 | 2.30-2.56 | 78.10-190.20 | 50.30-226.00 | |
| Mean | 2.17a | 2.39ab | 128.15a | 131.82ab | ||
| CV (%) | 4.77 | 3.91 | 30.34 | 49.45 | ||
| Jeollabuk-do | Range | 2.00-2.20 | 2.20-2.40 | 73.10-203.10 | 71.00-186.60 | |
| Mean | 2.07a | 2.30b | 142.87a | 127.67ab | ||
| CV (%) | 5.59 | 3.55 | 45.86 | 30.73 | ||
| Jeollanam-do | Range | 2.00-2.20 | 2.30-2.80 | 99.00-183.60 | 75.00-216.20 | |
| Mean | 2.16a | 2.48a | 148.06a | 130.98ab | ||
| CV (%) | 4.14 | 6.22 | 23.13 | 31.35 | ||
| Total range | 2.00-2.70 | 2.10-2.80 | 37.10-235.20 | 50.30-258.90 | ||
| Mean | 2.22 | 2.35 | 129.69 | 132.16 | ||
| CV (%) | 7.03 | 5.76 | 10.26 | 36.67 | ||
Variations of anthocyanin contents
The target anthocyanins were identified and quantified by HPLC using the corresponding external standards and the obtained concentrations for each of the soybeans are provided in Supplementary Table S1. In terms of their distribution, all the target anthocyanins were detected in every Soritae landrace. In Yakkong landraces, however, Pt-3-O-G and D-3-O-G were not detected in 16 and 11 soybeans, respectively. The soybeans showed wide variability in the levels of anthocyanins. As shown in Table 3, the TAC was in the ranges of 648.68-2573.60 ㎎/100 g in Soritae and 649.29-2569.16 ㎎/100 g in Yakkong landraces with means of 1916.65 and 1534.93 ㎎/100 g, respectively. Concerning individual anthocyanins, the contents of D-3-O-G, C-3-O-G and Pt-3-O-G were in the ranges of 34.50-593.76, 448.85-2277.13 and 11.03-116.90 ㎎/100 g in Soritae landraces with means of 276.97, 1567.83, and 71.85 ㎎/100 g, respectively. Likewise, the contents of D-3-O-G, C-3-O-G and Pt-3-O-G in Yakkong landraces were in the ranges of 0.00-733.24, 350.25-2315.75 and 0.00-250.96 ㎎/100 g with means of 306.61, 1111.06 and 117.26 ㎎/100 g, respectively.
The variations of anthocyanin contents between Soritae and Yakkong landraces within a collection area as well as across collection areas were investigated (Table 3). A comparative analysis showed that Soritae landraces contained a higher level of TAC than Yakkong landraces of similar origin except in Gangwon-do. The variation of TAC between Soritae and Yakkong landraces was significantly different in four collection areas including Gyeonggi-do, Jeju-do, Jeollabuk-do, and Jeollanam-do (p < 0.05). Among individual anthocyanins, C-3-O-G and Pt-3-O-G showed a contrasting trend. The former was dominant in Soritae landraces while the latter was dominant in Yakkong landraces irrespective of the collection area. Statistically, the average C-3-O-G content in Soritae landraces of Gyeonggi-do, Jeju-do and Jeollanam-do origins was significantly different from those of Yakkong landraces of similar origins (p < 0.05). Besides, three collection areas including Chungcheongbuk-do, Gangwon-do, and Gyeongsangnam-do showed significant variation in the level of Pt-3-O-G between Soritae and Yakkong landraces (p < 0.05). With regard to D-3-O-G content, there was no significant difference among Soritae and Yakkong landraces of similar origin except for Gangwon-do landraces (Table 3).
Table 3.
Variation of anthocyanin contents between Soritae and Yakkong landraces within a collection area (rows) and across collection areas (columns)
| Collection area | Values | D-3-O-Gz (㎎/100g) | C-3-O-Gy (㎎/100g) | Pt-3-O-Gx (㎎/100g) | TACw (㎎/100g) | |||||||
| Soritae | Yakkong | Soritae | Yakkong | Soritae | Yakkong | Soritae | Yakkong | |||||
|
Chungcheong buk-do | Range |
207.48- 593.76 |
160.06- 652.02 |
684.73- 2145.09 |
768.96- 1193.20 |
58.61- 101.55 |
118.93- 184.46 |
1148.43- 2467.96 |
1156.50- 1770.79 | |||
| Mean | 385.97a Au | 391.90a AB | 1387.17a AB | 966.25a A | 78.97b A | 136.39a AB | 1852.11a AB | 1494.54a A | ||||
| CVv (%) | 39.84 | 49.51 | 35.42 | 16.83 | 17.66 | 19.85 | 23.32 | 14.74 | ||||
|
Chungcheong nam-do | Range |
158.74- 373.84 |
172.87- 608.37 |
926.18- 2038.66 |
475.27- 1960.79 |
61.88- 109.56 |
0.00- 143.38 |
1349.20- 2400.28 |
850.23- 2569.16 | |||
| Mean | 282.69a AB | 353.71a AB | 1635.77a AB | 1160.03a A | 76.79a A | 53.09a B | 1995.25a AB | 1566.83a A | ||||
| CV (%) | 24.55 | 57.93 | 27.54 | 63.04 | 18.48 | 128.86 | 19.99 | 49.99 | ||||
| Gangwon-do | Range |
34.50- 511.99 |
0.00- 733.24 |
448.85- 1971.90 |
538.79- 2151.05 |
11.03- 89.89 |
0.00- 250.96 |
648.68- 2492.56 |
985.71- 2566.65 | |||
| Mean | 307.20b AB | 409.83a A | 1187.64a B | 1108.85a A | 57.10b A | 150.28a A | 1551.94a B | 1668.97a A | ||||
| CV (%) | 42.39 | 37.89 | 47.23 | 47.78 | 52.78 | 50.51 | 43.40 | 30.68 | ||||
| Gyeonggi-do | Range |
198.35- 526.76 |
0.00- 624.74 |
1065.26- 2228.80 |
356.78- 1660.12 |
50.78- 95.68 |
0.00- 241.94 |
1685.29- 2552.89 |
978.41- 1729.36 | |||
| Mean | 344.38a AB | 321.34a AB | 1915.96a A | 940.67b A | 80.61a A | 116.56a AB | 2340.94a A | 1378.57b A | ||||
| CV (%) | 36.31 | 64.19 | 22.18 | 45.10 | 20.52 | 70.79 | 14.17 | 17.16 | ||||
|
Gyeongsang buk-do | Range |
244.94- 381.36 |
0.00- 542.74 |
1472.37- 1711.13 |
649.29- 1693.30 |
54.06- 65.34 |
0.00- 226.85 |
1771.36- 2157.83 |
649.29- 2336.44 | |||
| Mean | 312.96a AB | 256.81a AB | 1583.01a AB | 1109.20a A | 59.95a A | 140.07a AB | 1955.91a AB | 1506.09a A | ||||
| CV (%) | 21.80 | 72.23 | 7.60 | 36.26 | 9.44 | 60.84 | 9.91 | 38.46 | ||||
|
Gyeongsang nam-do | Range |
148.14- 419.58 |
0.00- 415.92 |
713.41- 2248.58 |
650.64- 1984.23 |
45.95- 116.90 |
0.00- 214.75 |
992.25- 2567.30 |
1062.07- 2387.31 | |||
| Mean | 231.38a B | 273.25a AB | 1635.96a AB | 1298.28a A | 73.30b A | 125.76a AB | 1940.65a AB | 1697.29a A | ||||
| CV (%) | 27.81 | 53.49 | 29.44 | 34.98 | 21.87 | 63.96 | 24.71 | 23.36 | ||||
| Incheon | Range |
142.64- 309.62 |
0.00- 319.22 |
769.30- 2277.13 |
736.82- 2315.75 |
52.47- 110.35 |
0.00- 214.56 |
1113.02- 2573.60 |
1085.43- 2315.75 | |||
| Mean | 235.01a B | 199.20a B | 1533.69a AB | 1346.79a A | 77.61a A | 121.13a AB | 1846.31a AB | 1667.11a A | ||||
| CV (%) | 28.92 | 60.08 | 37.99 | 47.18 | 31.50 | 64.38 | 30.57 | 30.23 | ||||
| Jeju-do | Range |
144.43- 362.28 |
129.19- 315.69 |
1362.02- 1994.27 |
767.18- 1794.40 |
62.80- 93.04 |
59.81- 137.23 |
1674.83- 2239.67 |
1017.48- 2022.80 | |||
| Mean | 246.31a B | 237.15a AB | 1760.31a AB | 1153.42b A | 75.35a A | 96.59a AB | 2081.97a AB | 1487.16b A | ||||
| CV (%) | 32.70 | 31.03 | 12.59 | 33.96 | 14.99 | 35.13 | 9.93 | 26.04 | ||||
|
Jeolla buk-do | Range |
223.37- 236.87 |
0.00- 506.84 |
1535.63- 2000.40 |
521.07- 1832.16 |
44.06- 74.47 |
0.00- 169.70 |
1846.97- 2270.42 |
925.10- 1832.16 | |||
| Mean | 228.73a B | 212.58a B | 1793.89a AB | 1154.58a A | 59.83a A | 70.74a B | 2082.45a AB | 1437.91b A | ||||
| CV (%) | 3.13 | 95.89 | 13.19 | 43.57 | 25.47 | 109.12 | 10.36 | 28.30 | ||||
|
Jeolla nam- do | Range |
157.75- 388.56 |
0.00- 561.26 |
1796.13- 2024.44 |
350.25- 1940.45 |
65.09- 80.41 |
0.00- 216.23 |
2034.29- 2301.25 |
721.21- 2195.26 | |||
| Mean | 251.19a B | 278.13a AB | 1893.96a A | 1008.33b A | 71.64a A | 86.93a AB | 2216.79a A | 1373.39b A | ||||
| CV (%) | 37.34 | 68.88 | 4.86 | 54.12 | 8.84 | 75.40 | 4.89 | 36.13 | ||||
| Total range |
34.50- 593.76 |
0.00- 733.24 |
448.85- 2277.13 |
350.25- 2315.75 |
11.03- 116.90 |
0.00- 250.96 |
648.68- 2573.60 |
649.29- 2569.16 | ||||
| Mean | 276.97 | 306.61 | 1567.83 | 1111.06 | 71.85 | 117.26 | 1916.65 | 1534.93 | ||||
| CV (%) | 39.22 | 58.31 | 31.60 | 43.11 | 26.66 | 64.13 | 25.81 | 30.02 | ||||
The levels of each anthocyanin were also assessed across collection areas with regard to a specific landrace type (Fig. 2, Table 3). In Soritae landraces, the average TAC, C-3-O-G, and Pt-3-O-G were the highest in Gyeonggi-do (2340.94, 1915.96 and 80.61 ㎎/100 g, respectively) and the lowest in Gangwon-do (1551.94, 1187.64, and 57.10 ㎎/100 g, respectively), the variation of each except Pt-3-O-G being significantly different (p < 0.05) (Fig. 2A, Table 3). Moreover, the highest average D-3-O-G content was found in Chungcheongbuk-do landraces (385.97 ㎎/100 g) and this value was significantly different from the average D-3-O-G content found in Soritae landraces of Gyeongsangnam-do (231.38 ㎎/100 g), Incheon (235.01 ㎎/100 g), Jeju-do (246.31 ㎎/100 g), Jeollabuk-do (228.73 ㎎/100 g) and Jeollanam-do (251.19 ㎎/100 g) origins (p < 0.05). The variations of anthocyanin in Yakkong landraces of different origin was similarly assessed and a different trend was observed. The highest average TAC was found in Gyeongsangnam-do landraces (1697.29 ㎎/100 g), while the lowest average TAC was found in Jeollanam-do landraces (1373.39 ㎎/100 g). It can be seen from Fig. 2B and Table 3 that the difference in collection area did not bring a significant variation on the level of TAC among Yakkong landraces (p < 0.05). Similarly, the difference in the level of C-3-O-G among Yakkong landraces of different origins was not significant (p < 0.05). Furthermore, Yakkong landraces of Gangwon-do origin contained the highest average D-3-O-G (409.83 ㎎/100 g) and Pt-3-O-G (150.28 ㎎/100 g) contents, the former differing significantly from those of Incheon and Jeollabuk-do landraces while the latter from those of Jeollabuk-do and Chungcheongnam-do landraces (p < 0.05).
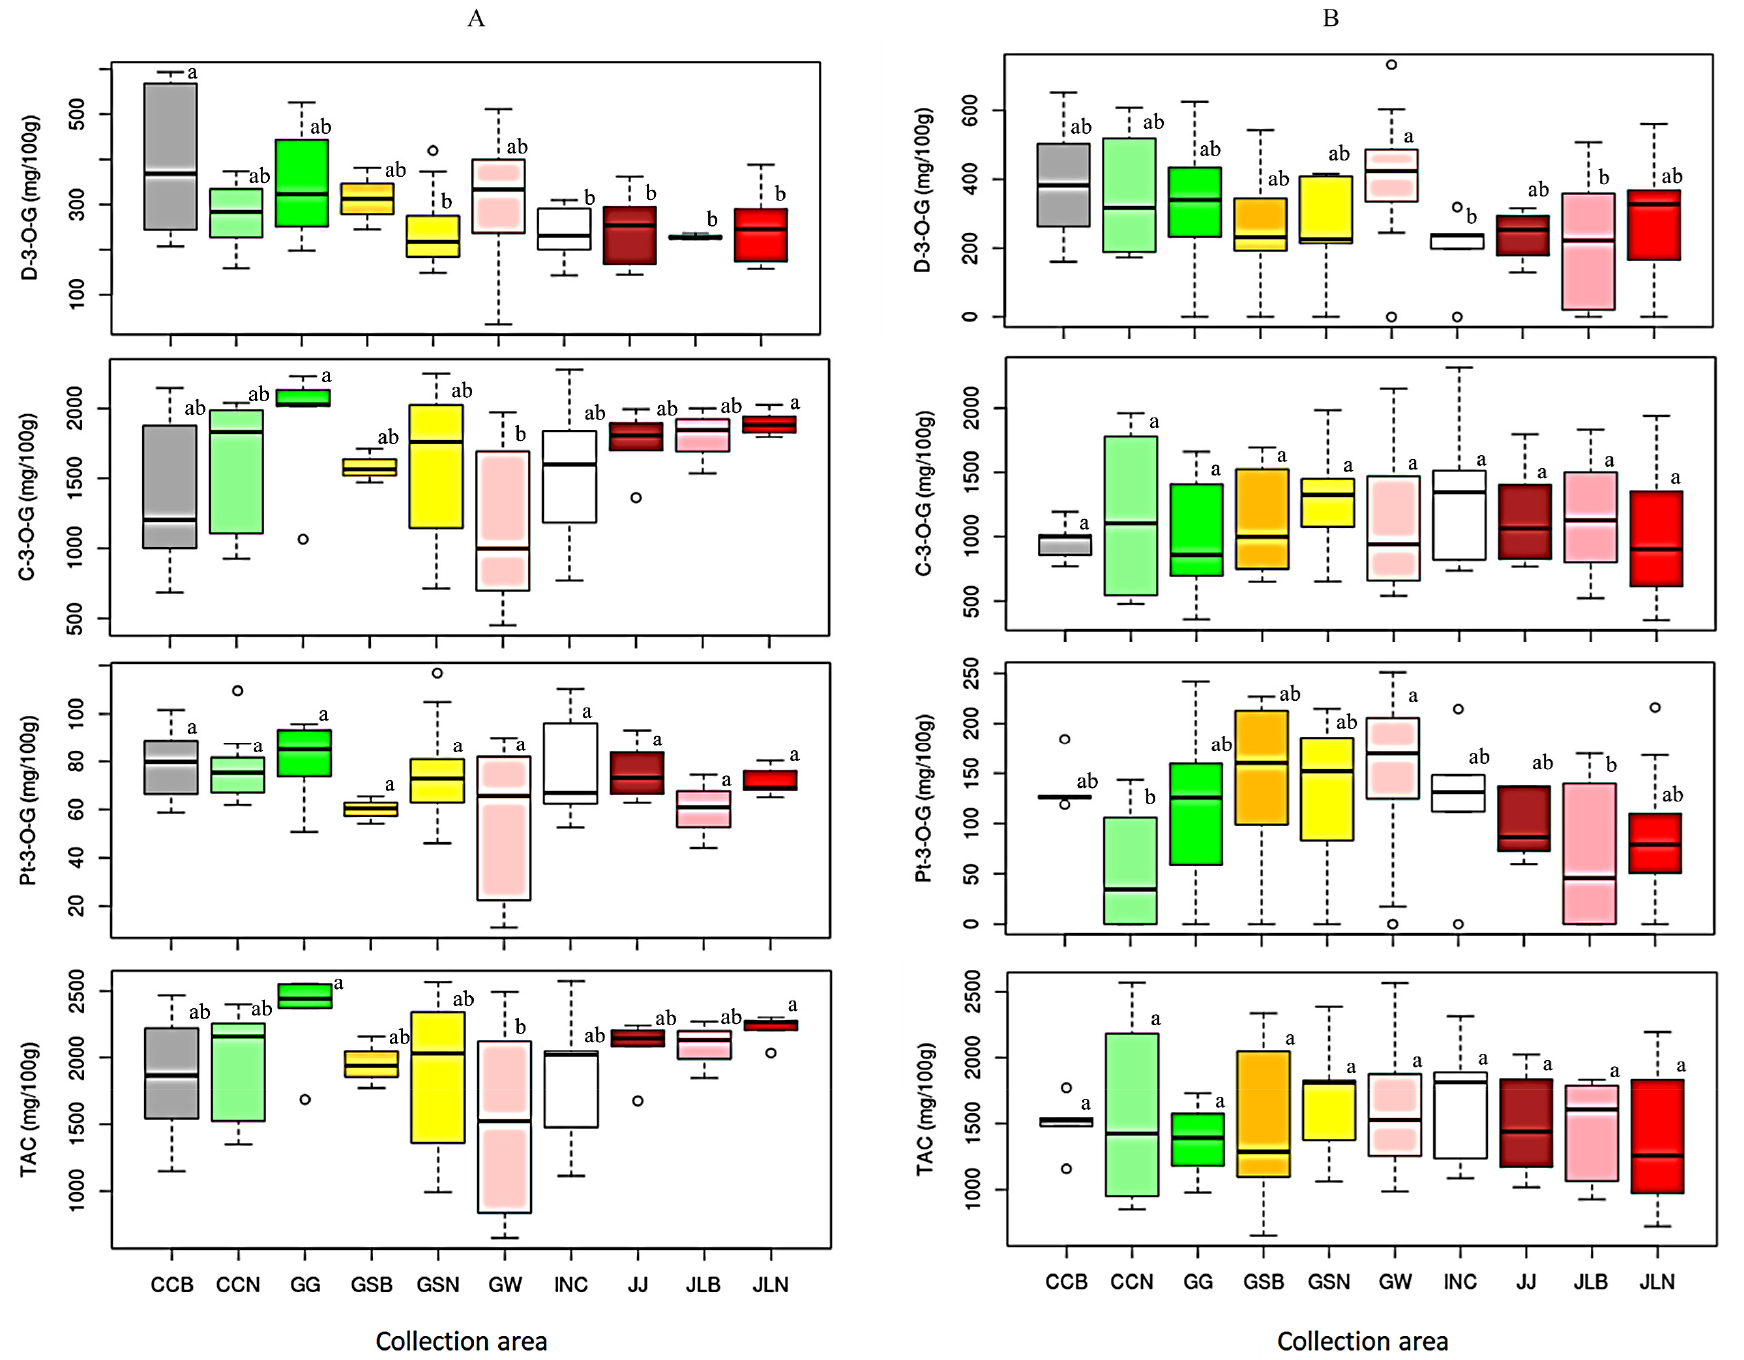
Fig. 2.
Variation of anthocyanin contents in Soritae (A) and Yakkong (B) soybean landraces between collection areas. C-3-O-G: Cyanidin-3-O-glucoside; CCB: Chungcheongbuk-do; CCN: Chungcheongnam-do; D-3-O-G: Delphinidin-3-O-glucoside; GW: Gangwon-do; GG: Gyeonggi-do; GSB: Gyeongsangbuk-do; GSN: Gyeongsangnam-do; INC: Incheon; JJ: Jeju-do; JLB: Jeollabuk-do; JLN: Jeollanam-do; Pt-3-O-G: Petunidin-3-O-glucoside; TAC: Total anthocyanin content. Different letters on box plots in a category represent significantly different mean values (p < 0.05).
Principal component and correlation analysis
To further view the variations of Yakkong and Soritae landraces and their relationship with yield components and anthocyanin contents, PCA was conducted using the whole data set. Besides, Pearson’s correlation analysis was computed to see the pair-wise association between the studied variables. As shown in the score plot (Fig. 3A), the PCA separated the soybeans according to their landrace types along with the first three components. The first (PC1), second (PC2) and third (PC3) components contributed 36.8, 25.6 and 14.6% of the total variation, respectively. The loading plot of the variables showed that HSW, TAC and C-3-O-G were the most significant variables that discriminated Soritae landraces along PC2 (Fig. 3B). For Yakkong landraces, variables including Pt-3-O-G, D-3-O-G and SPP had greater contributions along PC1. The finding from Pearson’s correlation analysis was also congruent with the PCA results. A strong association was observed between TAC with C-3-O-G irrespective of landrace type (Fig. 3C, D). The correlation coefficient (r) value between TAC and C-3-O-G was 0.972 in Soritae and 0.885 in Yakkong landraces. Besides, a stronger association between HSW and TAC was observed in Soritae landraces (r = 0.453) than in Yakkong landraces (r = 0.122) which agreed with the PCA results. Notably, the yield components showed negative or poor associations with each other irrespective of landrace type.
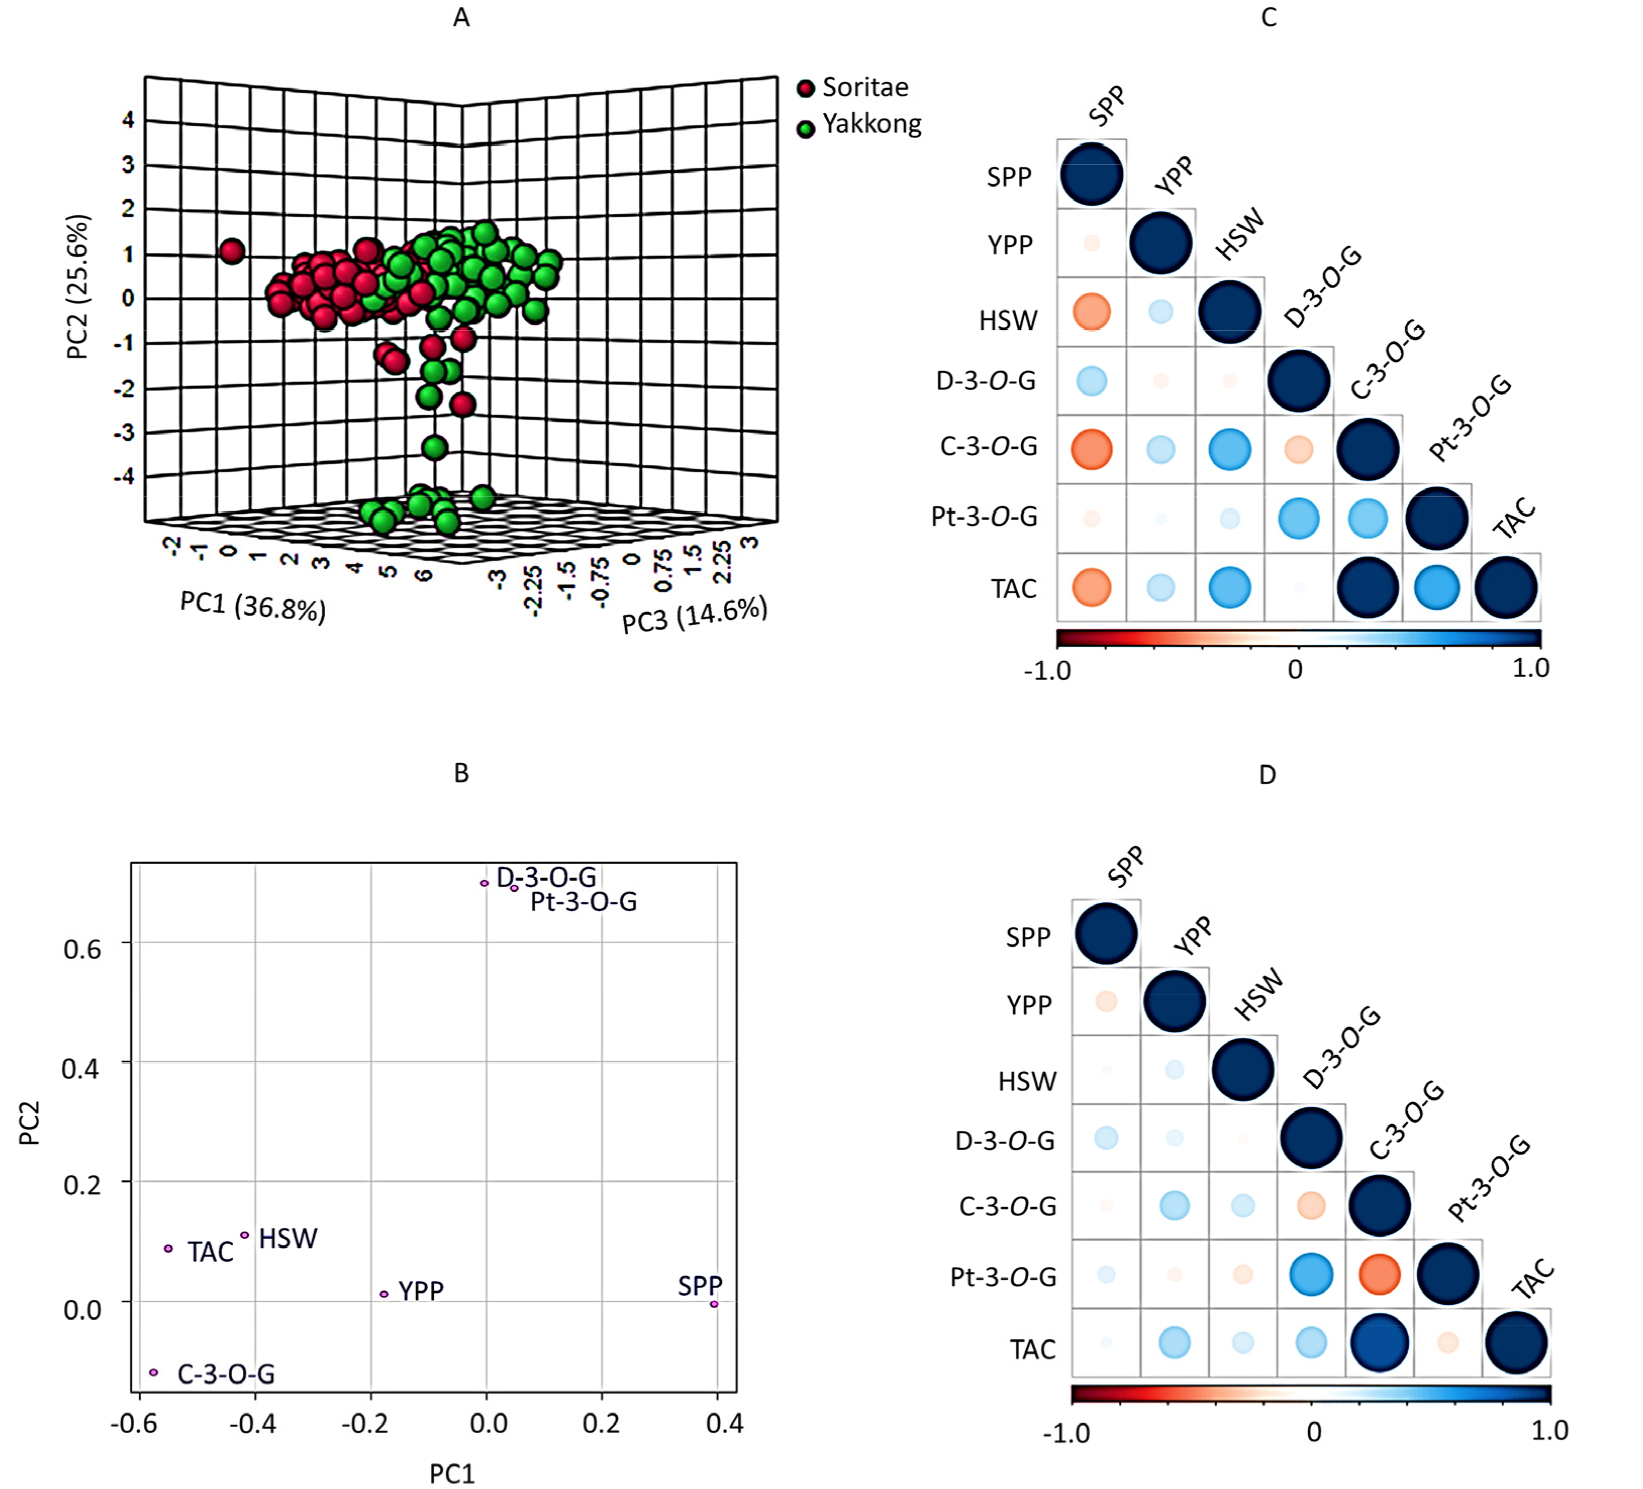
Fig. 3.
Score plot of soybean landraces (A) and loading plot of variables (B) from in the principal component analysis and pair-wise correlation between variables in Soritae (C) and Yakkong (D) landraces. C-3-O-G: Cyanidin-3-O-glucoside; D-3-O-G: Delphinidin- 3-O-glucoside; HSW: One-hundred seeds weight; Pt-3-O-G: Petunidin-3-O-glucoside; SPP: Number of seeds per pod; YPP: Yield per plant; TAC: Total anthocyanin content.
Discussion
In the past few decades, soybean has gained popularity in various sectors owing to its heatlh benefits and disease- protective properties. Also, several studies have been conducted with the aim of improving its production to meet the increasing global demand (Battisti et al., 2017; Li et al., 2017; Wang et al., 2015). In line with these, soybean yield components and metabolites, which are influenced by numerous environmental, genotypic, and crop management factors, have been targeted (Carciochi et al., 2019). Researchers have identified several genes that control yield components which in turn are used during cultivar developments (Bianchi et al., 2020; Wang et al., 2015).
In this study, the variations of three of the most important yield components including HSW, SPP and YPP were analyzed with regard to landrace type and collection area. As expected, a large variation in HSW was observed between landrace types. Soritae landraces displayed a higher average HSW than Yakkong landraces irrespective of their collection areas. Previous studies also noted a significant variation of HSW between different black soybean landraces which agreed with our findings (Lee et al., 2014; Yi et al., 2009). By comparison, the average HSW (32.02 g) of Soritae landraces found in this study was slightly lower than a previously reported value (39.13 g) where the soybeans were grown in Gangwon-do (Lee et al., 2014). In another study, a much wider range of HSW (12.9-54.9 g) was reported in black soybeans grown in Jeollanam-do, though the soybeans were not grouped according to their seed size or varieties (Kwon et al., 2002). In addition to the difference in genotype, variations in cultivation year and conditions could cause the observed differences between these previous studies and our results (Carciochi et al., 2019). The online crop information center of the Rural Development Administration (Jeonju, Korea) classifies soybeans as small (< 13 g), medium (13-24 g) and large (> 24 g) seeds based on their HSW (Kim et al., 2012). Accordingly, all the Soritae landraces investigated in this study were large-size soybeans irrespective of their collection areas. Similarly, all the Yakkong landraces were small-size soybeans except nine landraces which were medium in size. Among the nine medium-size soybeans, two were collected from Gangwon-do (IT No.: 211785 and 201849), four were collected from Gyeonggi-do (IT No.: 201832, 201859, 201852 and 201851) and three were collected from Jeollanam-do (IT No.: 201855, 213326 and 263106). In general, our findings further support previous results where black soybeans of Soritae and Yakkong landraces were identified based on their seed size (Hwang et al., 2012; Im et al., 2006; Kim et al., 2018). Moreover, the wide HSW variability found between Soritae and Yakkong landraces signifies that they could provide wide spectrum of options during landraces development. Differences were also observed with regard to SPP and YPP between the soybeans. Although Yakkong landraces displayed higher values of both SPP and YPP than Soritae landraces, the variations were not significant (p < 0.05). Similarly, Soritae landraces of different origins did not show significant variation in SPP and YPP (p < 0.05). A recent study verified that SPP is only slightly influenced though it is a highly heritable trait (Bianchi et al., 2020). High-yielding soybean cultivars are anticipated not only by producers but also by breeders (Battisti et al., 2017; Seo et al., 2020). In this regard, Soritae landraces of Gyeongsangbuk-do origin and Yakkong landraces of Incheon origin could be important genetic resources.
Anthocyanins are one of the most important secondary metabolites found in black soybeans. Apart from their health- promoting properties for humans, anthocyanins play a vital role in the pigmentation of black soybeans because they are usually accumulated in the seed coats (Koh et al., 2014). In this study, we investigated the distribution and levels of three common anthocyanins including D-3-O-G, C-3-O-G and Pt-3-O-G using seed coat extracts. The anthocyanins were identified and quantified using the corresponding standards as described before. A comparative analysis showed that Yakkong landraces had a higher coefficient of variation (%CV) than Soritae landraces signifying a wider genetic difference. Among the three target anthocyanins, the level of C-3-O-G was dominant irrespective of landrace type and collection area which agreed with many previous studies (Cho et al., 2013; Choi et al., 2021; Choung et al., 2001; Koh et al., 2014; Lee et al., 2016). With few exceptions, Soritae landraces were characterized by a higher level of C-3-O-G and TAC than Yakkong landraces of similar origin, whereas Yakkong landraces had a higher level of Pt-3-O-G than Soritae landraces of similar origin. Previously, a higher TAC was also reported in Soritae landraces compared to other black and yellow soybean genotypes (Lee et al., 2014). In general, our findings suggest that Soritae landraces could be sources of high concentrations of total anthocyanin. Previous studies verified that growing conditions and collection areas affect the levels of anthocyanin in black soybeans even if such studies are still limited (Hong et al., 2010; Kim et al., 2012; Wu et al., 2017). In line with this, there were few studies conducted in Korea that showed the variation of anthocyanin contents among black soybean genotypes. For instance, Yi et al. (2008) showed the variations of C-3-O-G, D-3-O-G and Pt-3-O-G using 292 black soybean genotypes collected from the various provinces of Korea. Other studies showed the effect of growing location on the levels of these three and other anthocyanins (Ha et al., 2009; Hong et al., 2010; Yi et al., 2009). In this study, we showed the variation of the three common anthocyanins across ten collection areas. Our findings suggest that Soritae landraces of Gyeonggi-do origin and Yakkong landraces of Gyeongsangnam-do origin could be good resources of anthocyanin owing to the accumulation of a high level of TAC in their seeds.
PCA is one of the most commonly used chemometric tools used to view the variation between samples, and identify the variables that contribute the most to the observed differences and their association with each other (Kim et al., 2013). In this study, PCA and correlation analysis were conducted to further view the relationship between the soybean landraces and the variables. The PCA discriminated Soritae and Yakkong landraces and both yield components and anthocyanins had important roles. In particular, HSW, TAC and C-3-O-G were the variables that discriminated Soritae landraces while Pt-3-O-G, D-3-O-G and SPP were the variables that discriminated Yakkong landraces. The strong association between TAC and C-3-O-G, the principal anthocyanin in black soybeans, was also observed in the PCA and correlation analysis which agreed with previous studies (Choi et al., 2021; Lee et al., 2016). Besides, poor associations between yield components were previously reported which agreed with our results (Choi et al., 2016; Pandey and Torrie, 1973). To conclude, we analyzed three key yield components and three common anthocyanins in a large population of Soritae and Yakkong black soybean landraces that were grown in Korea and evaluated the influence of landrace type and origin on each. The soybeans showed wide variation in both yield components and the level of anthocyanins. Soritae landraces were characterized by a higher HSW and TAC level, whereas Yakkong landraces had a higher YPP. Among the studied soybeans, nine Soritae landraces and one Yakkong landrace were identified as important genetic resources owing to their high YPP and TAC levels simultaneously containing the three target anthocyanins (Table 4). Overall, the results of this study could initiate molecular-level investigations and boost the use of Yakkong and Soritae landraces in soybean breeding. As part of an ongoing study, we intend to evaluate the influence of cultivation year along with phylogeographic analysis in the future.
Table 4.
Selected black soybean landraces with high yield per plant and total anthocyanin content
| IT No.z | Collection area | Landrace |
YPPy (g/plant) |
D-3-O-Gx (㎎/100g) |
C-3-O-Gw (㎎/100g) |
Pt-3-O-Gv (㎎/100g) |
TACu (㎎/100g) |
| 178012 | Gyeongsangnam-do | Soritae | 174.50 | 372.83 ± 41.76 | 2084.81 ± 197.81 | 94.77 ± 7.82 | 2552.41 ± 116.81 |
| 274772 | Gyeongsangnam-do | Soritae | 199.50 | 274.88 ± 12.04 | 2170.20 ± 18.34 | 68.00 ± 1.25 | 2513.08 ± 12.69 |
| 216135 | Gyeongsangnam-do | Soritae | 162.20 | 419.58 ± 2.86 | 1896.68 ± 42.92 | 93.88 ± 0.86 | 2410.14 ± 24.84 |
| 274568 | Gyeongsangnam-do | Soritae | 194.80 | 152.34 ± 6.44 | 2121.04 ± 51.90 | 68.10 ± 2.69 | 2341.48 ± 30.24 |
| 252252 | Chungcheongbuk-do | Soritae | 235.20 | 237.87 ± 19.27 | 2145.09 ± 87.50 | 85.00 ± 3.75 | 2467.96 ± 51.77 |
| 177558 | Chungcheongnam-do | Soritae | 153.00 | 283.10 ± 0.69 | 2038.66 ± 58.84 | 78.52 ± 0.71 | 2400.28 ± 33.98 |
| 252530 | Chungcheongbuk-do | Soritae | 159.20 | 235.04 ± 1.49 | 2005.97 ± 2.79 | 66.97 ± 0.42 | 2307.98 ± 1.84 |
| 177257 | Gyeonggi-do | Soritae | 176.70 | 368.81 ± 23.70 | 2133.21 ± 67.08 | 50.78 ± 1.70 | 2552.80 ± 41.09 |
| 215992 | Gangwon-do | Soritae | 219.80 | 368.29 ± 14.41 | 1869.48 ± 16.90 | 84.25 ± 0.51 | 2322.02 ± 12.82 |
| 219760 | Gangwon-do | Yakkong | 249.80 | 508.96 ± 2.84 | 1738.51 ± 4.63 | 228.30 ± 2.79 | 2475.77 ± 3.52 |
