

Introduction
Materials and Methods
Construction of soil moisture control system including soil sensing and automatic water supply chain
Plant materials, cultivation and soil moisture sensing
Investigation of growth and development
Statistical analysis
Results and Discussion
Evaluation of the automatic soil moisture control system on farmland and on pot condition
Plant growth and development by gradient soil moisture on open farmland condition
Plant growth on open quadrangle plastic containers condition
Introduction
Major limiting factors for crop production are light, air temperature, air, soil texture and moisture in agriculture (Henderson et al., 2018; Jeong et al., 2021; Lee et al., 2010b, 2000). Soil moisture is a limiting factor of plant growth and development and more than 50% content of soil induce severe reduction for crop productivity on upland fields (Henderson et al., 2018). In general, it is reported that approximately 50% of soil moisture is a maximum content for normal plant growth and development (Henderson et al., 2018; Khlid, 2006; Lee et al., 1999, 2008; Osakabe et al., 2014). It is well known that microclimate conditions, such as air temperature, relative humidity and solar radiation, can influence plant evaporation rate, water demand, and eventually irrigation frequency and amount (Henderson et al., 2018). Variation in water usage is not a limiting factor when irrigating, areas of under- and overwatering may develop, which can reduce plant growth through drought or flooding stress (Henderson et al., 2018; Khalid, 2006; Lee et al., 1999, 2008; Osakabe et al., 2014).
Soil moisture sensor-based systems are promising; however, there is not enough information on crop type, or field condition. It is important to position enough sensors throughout a field to ensure that over- or under-watering of plants in certain locations is not occurring (Kang et al., 2020; 2021). Recently development of sensing technology and data analysis technique leads to automation of agronomy labors, and data based agriculture is enriched through cloud technology (Henderson et al., 2018; Kim et al., 2021). So far, limited automatic irrigation system that controlled and warned about under- and overwatering message is partly used in open field agriculture (Kang et al., 2020; Henderson et al., 2018).
Platycodon grandiflorum is a perennial plant belonging to Campanulaceae, and is native to all parts of Korea. And it is a wild vegetable which represents the only genus and species in the world (Choi and Lee, 2018; Kwon et al., 2019). In addition, P. grandiflorum contains proteins, lipids, sugars, ash, iron, saponin, inulin and phytosterin. Especially, it is well used as medicinal purposes because it is well known to exhibit various pharmacological actions such as expectorant, antitussive, antibacterial, hypotensive and hypoglycemic (Choi and Lee, 2018; Lee et al., 2010a; 2010b). As an important traditional herbal medicine, its root is used to treat several diseases including, hyperlipidemia, hypertension, and diabetes (Lee et al., 2010a, 2010b; Seong et al., 2004). Therefore, many studies have focused on increasing the yield of P. grandiflorum through differrent approaches (Lee et al., 1999; 2000), particulary fertilization and irrigation (Jeong et al., 2020; Kwon et al., 2019; Lee et al., 2010a, 2010b).
In this study, in order to establish and utilize an automatic irrigation system on open field, the basic data for determine the soil moisture condition and the growth and development characters are monitored in the cultivation of P. grandiflorum which is highly utilize as a medicinal resources.
Materials and Methods
Construction of soil moisture control system including soil sensing and automatic water supply chain
Soil moisture control system (AcroTNS Com., Korea) including soil sensing (WT1000B, MiraeSensor Com., Korea) and automatic water supply chain was constructed at the upland fields of University Farm, Sunchon National University (Sucheon, South Korea) with 333 ㎡ on December, 2020 (Lee et al., 2021). As the same manner, the soil moisture control system (AcroTNS Com., Korea) was constructed at pot level with soil sensors (WT1000A, MiraeSensor Com., Korea) as well. Quadrangle plastic containers (760 × 470 × 190 ㎣) were filled with bed soil of Sungwha Company (Sungwha Com., South Korea) in the received state. All sensors were inserted from the top surface of the growing substrate in the soil (6 ㎝ to 11.5 ㎝ in depth of the sensor cell), and measured and recorded by 2 mim. Soil moisture content was controlled by 20%, 30%, 40% and 50%, respectively. This procedure was also conducted with manual of AcroTNS Company (AcroTNS Com., South Korea).
Plant materials, cultivation and soil moisture sensing
First-year bellflowers (Platycodon grandiflorus) and 2nd-year bellflowers (Platycodon grandiflorus) with 5 to 6 leaves were used for cultivation purchased from bellflower plantation (Bellflower Farm, South Korea). The first-year bellflower seedlings were transplanted to farmland fields which is controlled by the soil moisture control system (AcroTNS Com., South Korea) on May 26th, 2021, and the 2nd-year bellflower seedlings were transplanted to the fields on April 28th, 2021. Five to six leaf seedlings of bellflowers were cultivated with 15 ㎝ in row x 30 ㎝ in column, on both the farmland fields and the quadrangle plastic containers. The soil components used in this experiment were shown in Table 1. The farmland was mulched with black vinyl film with 100 ㎝ in width. Moreover, A total of 15 quadrangle plastic containers (760 × 470 × 190 ㎣) were filled with a Sungwha Tobaegi bed soil (Sungwha Com., South Korea) and 12 plant seedlings per the plastic containers were transplanted as the saqme manner on July 29th, 2021. All agricultural practices, other than the experimental treatments, were done according to the recommendation of the RDA, Korea (Rural Development Administration, 2012).
Table 1.
Table 1. Characteristics of soil components of the cultivation soil of farm at Sunchon National University (SCNU), South Korea
| Item | pH | Organic Matter | P | K | Ca | Mg |
Electric Conductivity |
| Site | (1:5) | (g/㎏) | (㎎/㎏) | (c㏖+/㎏) | (c㏖+/㎏) | (c㏖+/㎏) | (dS/m) |
| Az | 5.7 | 10 | 9 | 0.42 | 4.5 | 4.8 | 0.2 |
| By | 5.2 | 14 | 89 | 0.45 | 6.7 | 3.7 | 0.2 |
| Cx | 5.9 | 27 | 170 | 0.73 | 5.6 | 2.3 | 0.2 |
| Mean | 5.60 | 17.00 | 89.33 | 0.53 | 5.60 | 3.60 | 0.20 |
| Optimal Range | 6.0~7.0 | 20~30 | 300~550 | 0.5~0.8 | 5.0~6.0 | 1.5~2.0 | <2 |
Soil moisture sensing was executed by the sensors (WT1000B and WT1000A, MiraeSensor Com., South Korea) on the surface of soil with 6 ㎝ to 11.5 ㎝ in depth. Moreover, EC (Electric conductivity) and soil temperature were checked, also. Soil moisture was monitored and recorded using moisture sensor plugged into data loggers at 2-min intervals over the entire growth cycle. Sensors were inserted into the substrate from the top, with sensor prongs close to the center of the ridge and the containers (Henderson et al., 2018; Lee et al., 2021).
Investigation of growth and development
Two months after transplanting, plant height, SPAD value, stem diameter, the length and width of each plant leaves, branch number and capsule number were measured (Lee et al., 2008; Rural Development Administration, 2012).
Statistical analysis
All of the experiments were executed with three replication. Using the SAS program (SAS, 9.2, Institute Inc, USA), statistical analysis was conducted by Duncan’s multiple range test (DMRT, p = 0.05). Frequency and percentage were used to analysis the qualitative characters whereas mean and standard deviation were used for quantitative data analysis.
Results and Discussion
In order to obtain a basic data of automatic irrigation system, monitoring for the soil moisture content and investigation of the plant growth and development were executed on the base of automatic soil moisture content control system under farmland and pot conditions.
Evaluation of the automatic soil moisture control system on farmland and on pot condition
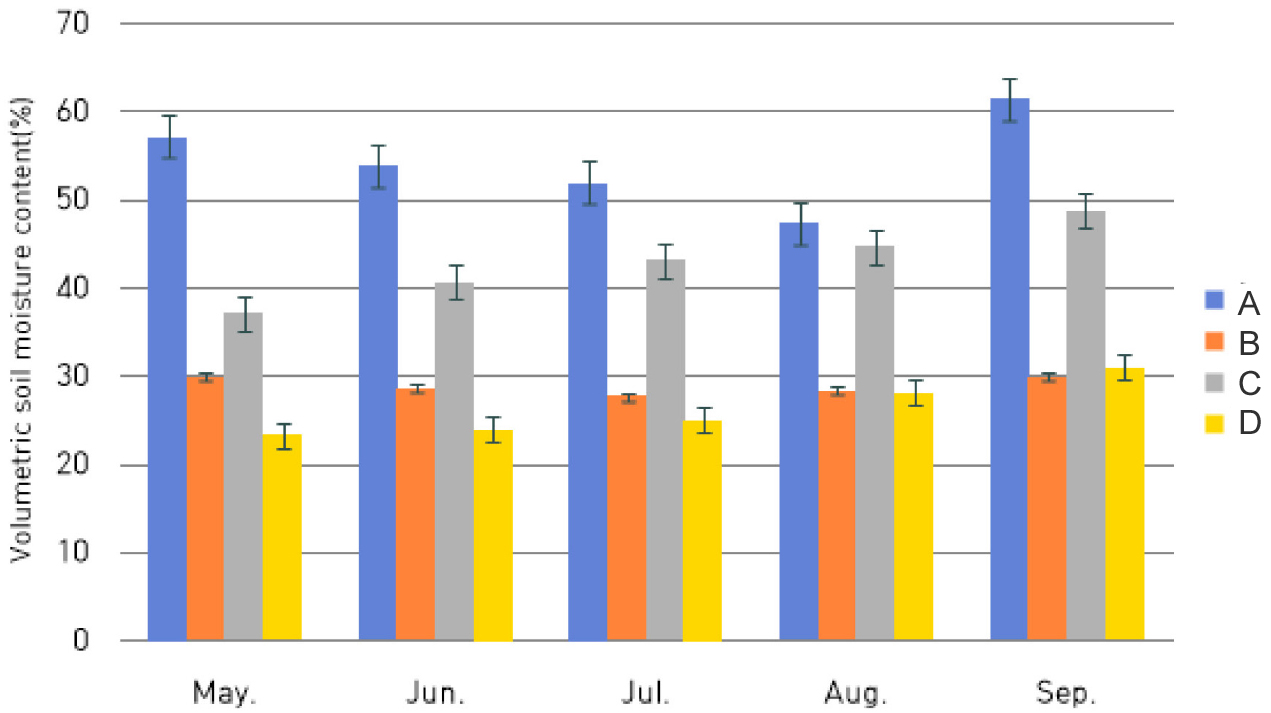
On the base of automatic soil moisture control system, the soil moisture was controlled from 20%, 30%, 40% and 50%, respectively, and the moisture contents were measured from May to September, 2021 (Fig. 1). The soil moisture content was controlled by the system showing over the soil moisture contents except 40% treatment. The 40% treatment shows 30% soil moisture which is lower than that of the established. The reason showing the higher soil moisture might be resulted from differences by rainfall, drainage and uniformity of soil surface. Meanwhile, the reason showing the lower soil moisture content might be resulted from insertion position of sensor on the surface of farmland fields. Therefore, the position of sensors at the ridges is very important when soil moisture content is monitored on open farmland condition (Henderson et al., 2018; Kang et al., 2020, 2021). Although daily changes of soil moisture showed transient increase by rainfall (not shown data), monthly average of the soil moisture content has kept constant level.
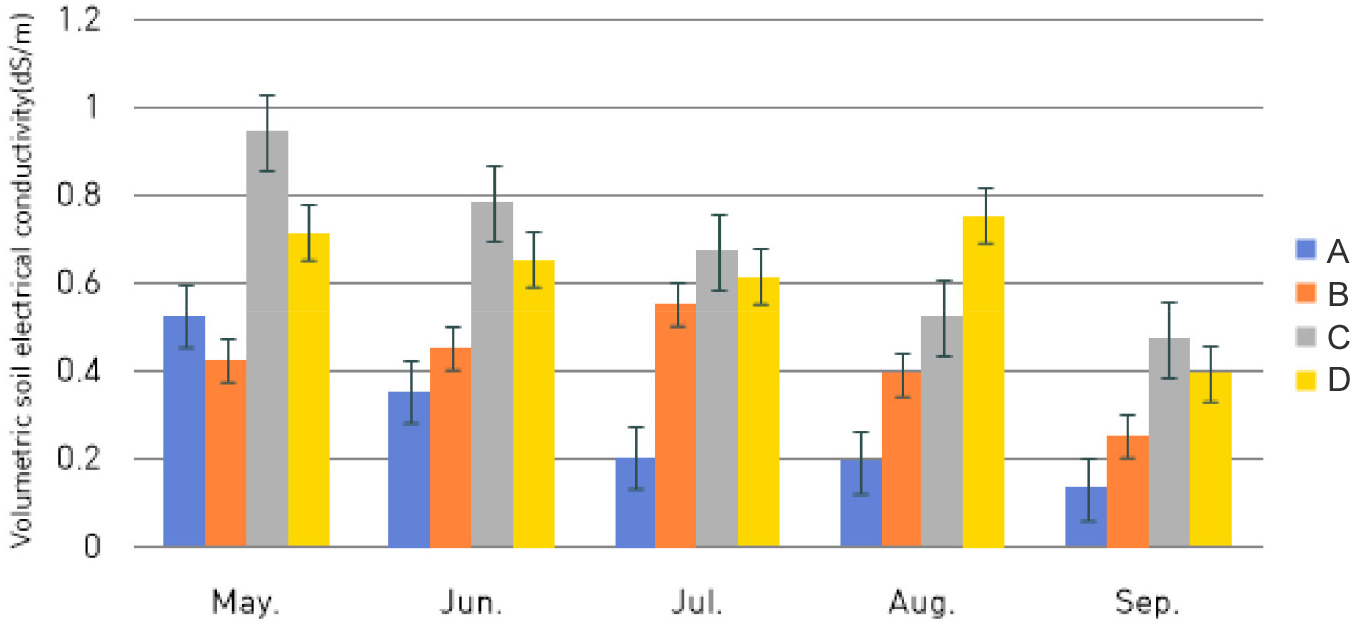
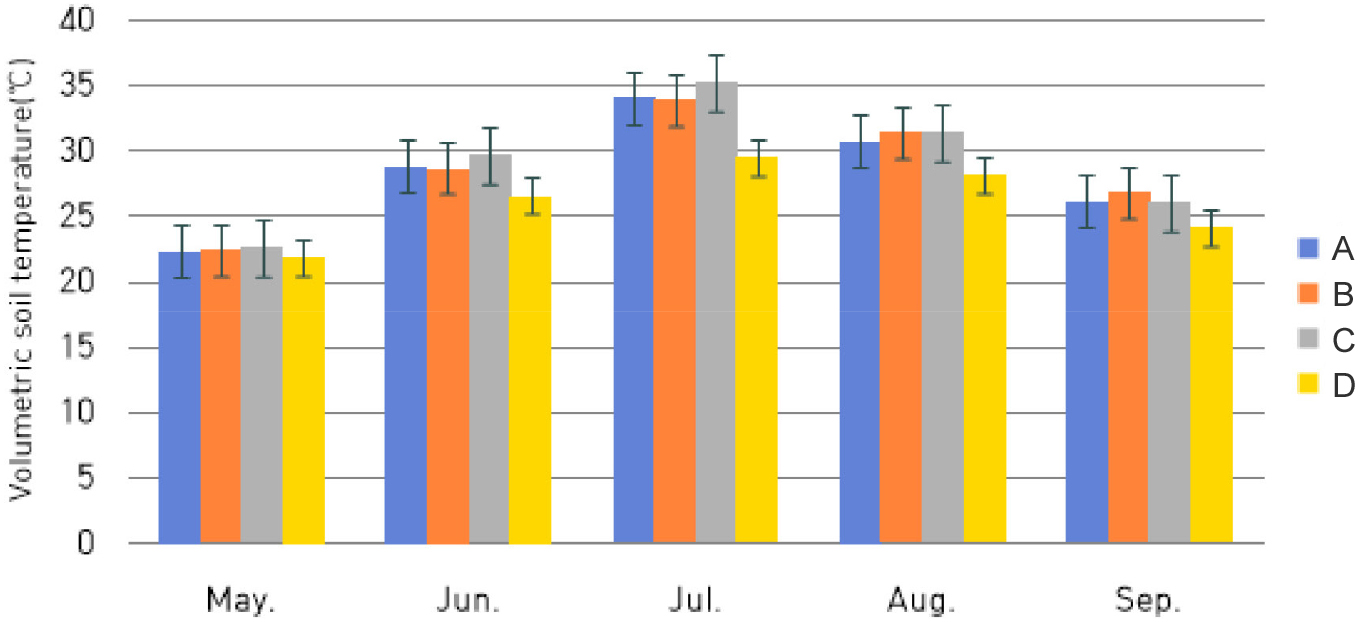
As shown in Fig. 2, monthly average EC was high at low contents of soil moisture content, 20% and 30%. Interestingly, its values of 50% and 30% soil moisture were decreased by the passed cultivation time at low contents of soil moisture. However, that of 40% and 20% showed peak on July and on August, respectively (Fig. 2). Generally EC of soil and nutrient media is decrease by the passed cultivation time, because nutrients were consumed by crops and some of minerals are leached (Jeong et al., 2020; Henderson et al., 2018; Kang et al., 2020, 2021). Kang et al. (2020) reported EC value was decreased by plant growth on farmland field. Soil temperature is increased steadily from May to July, and then decreased on August (Fig. 3). The soil temperature is not necessarily accorded to the air temperature at the field, in Suncheon, South Korea.
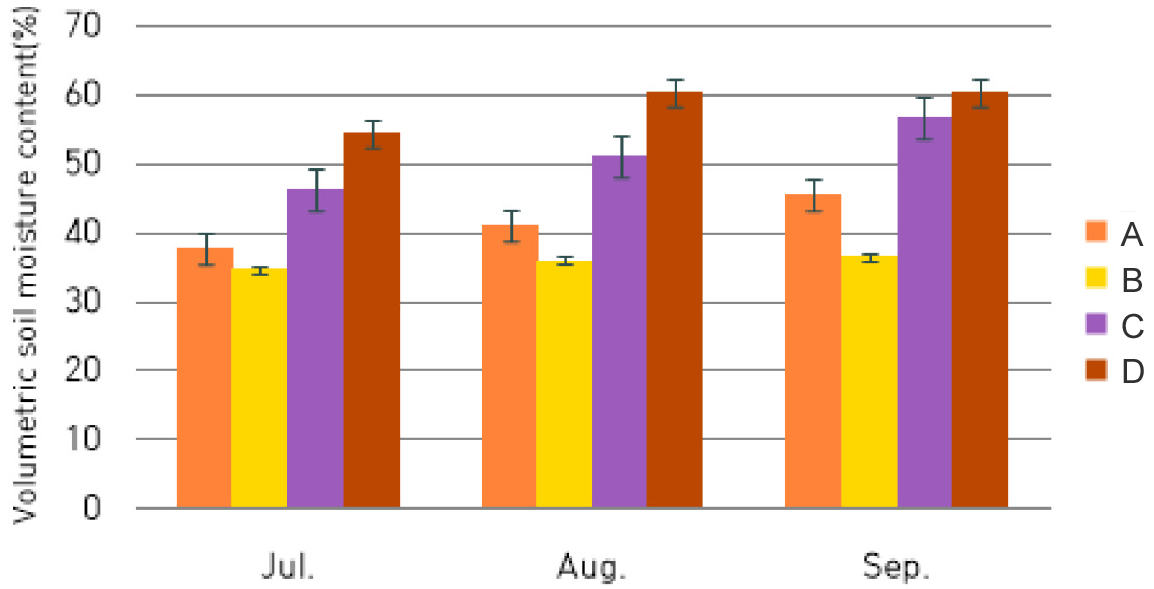
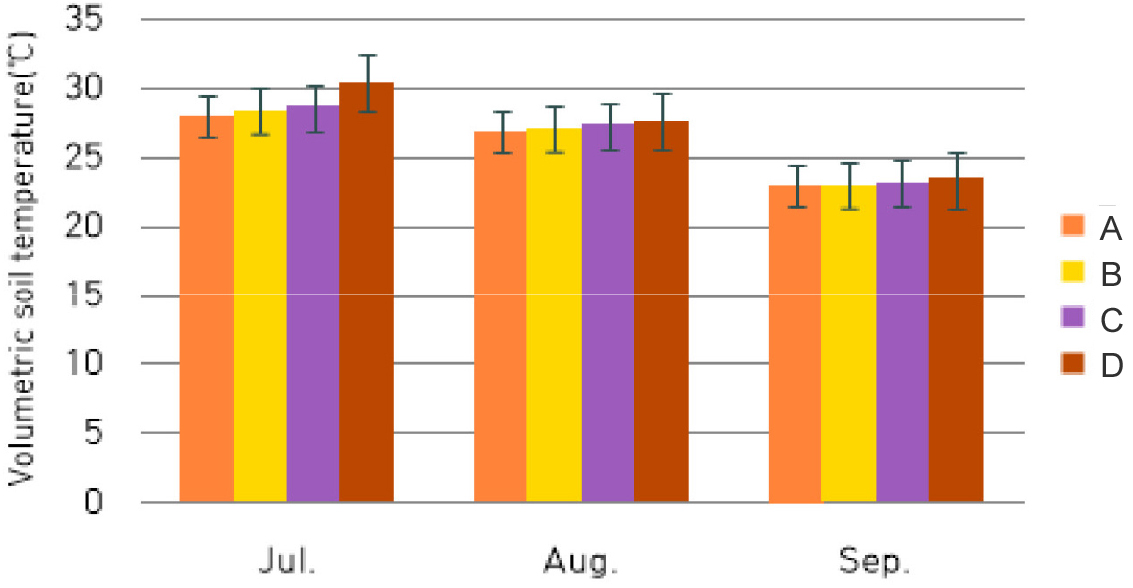
In case of quadrangle plastic containers, the soil moisture was controlled from 20%, 30%, 40% and 50%, respectively, on the base of automatic soil moisture control system, and the moisture contents were measured from July to September, 2021. Soil moisture was controlled by the system showing over the soil moisture contents which was controlled by the automatic irrigation system (Fig. 4). Soil moisture of 20% showed more severe high soil moisture content compared with the other controlled soil moisture. Soil temperature was decreased gradually from July to August, 2021 (Fig. 5). This result is consistent with that of the farmland soil in this study.
As a result of monitoring of the soil moisture by using automatic irrigation control system including soil sensing and automatic water supply chain, the system was worked properly. In order to measure precise soil moisture sensor insertion position on the soil surface is very important in both field soil and pot soil conditions.
Plant growth and development by gradient soil moisture on open farmland condition
The growth and development of 1st-year bellflowers was shown in Table 2. While plant height was not significantly taller than that of control, and it in 2nd-year plants was taller than that of 1st-year plants. Leaf length/width ratio and main stem diameter were decreased by increasing water contents compared with control. Even though it is not significantly decreased, a kind of chlorophyll content factor, SPAD value is decreased by increasing water contents compared with control as well. Capsule number of the plants is increased by increasing water contents compared with control. The result means higher soil moisture act on limiting factor to plant growth and it is consistent with the other case (Kang et al., 2021; Khalid, 2006). However, the numbers of branch were increased by high soil moisture compared with control on farmland soil condition, especially, the number was over two times higher at 40% and 50% compared with control and 20% soil moisture contents.
Table 2.
Characteristics of growth and development of bellflower (Platycodon grandiflorum) with 1st-year cultivation at the field by automatically controlled soil water gradients (contents)
|
Plant Height (㎝) |
Leaf Length
(㎜) (A) |
Leaf Width (㎜) (B) |
Leaf Length/ Leaf Width (A/B) | SPAD Value |
Diameter of Main Stem (㎜) |
Branch No. |
Caps-ule No. | ||
| Control | 43.4bz | 71.4a | 39.0c | 1.83:1 | 48.1a | 14.3a | 1.60b | 106.8b | |
| Water cont | 20% | 45.4ab | 73.8a | 42.2bc | 1.75:1 | 48.1a | 13.9a | 1.60b | 107.4b |
| 30% | 45.4ab | 74.6a | 45.2ab | 1.65:1 | 46.9a | 14.3a | 2.40b | 126.0a | |
| 40% | 47.2ab | 76.6a | 44.4abc | 1.73:1 | 43.1a | 13.4a | 4.40a | 88.0c | |
| 50% | 48.4a | 78.6a | 48.4a | 1.62:1 | 46.4a | 13.4a | 3.80a | 82.8c | |
The growth and development of 2nd-year bellflowers was shown in Table 3. Plant height did not show significant difference except 20% soil moisture. Leaf length/width ratio also did not show significant difference. Main stem diameter was decreased by increasing 40% and 50% water contents compared with control. SPAD value was significantly decreased by increasing water contents compared with control as well. Capsule number was increased by increasing water contents compared with control except 50% soil moisture. The result means higher soil moisture act on repressor plant growth, and it is consistent with other crop plants (Kang et al., 2021; Khalid, 2006). Especially, Henderson et al. (2018) reported that approximately 50% of soil moisture is a maximum content for normal plant growth and development and it leads severe reduction for crop productivity on upland fields.
Table 3.
Characteristics of growth and development of bellflower (Platycodon grandiflorum) with 2nd-year (2-year-old) cultivation at the field by automatically controlled soil water gradients
|
Plant Height (㎝) |
Leaf Length (㎜) (A) |
Leaf Width
(㎜) (B) |
Leaf Length/ Leaf Width (A/B) | SPAD Value |
Diameter of Main Stem (㎜) | Branch No. | Capsu-le No. | ||
| Control | 52.5abz | 81.4a | 43.0a | 1.89:1 | 34.9a | 14.5b | 1.80a | 77.8a | |
| Water cont | 20% | 49.4bc | 79.8a | 40.7ab | 1.96:1 | 33.0b | 13.0d | 2.20a | 80.6a |
| 30% | 53.2a | 80.2a | 38.0b | 2.11:1 | 34.3a | 15.2a | 2.40a | 87.2a | |
| 40% | 53.6a | 75.6a | 43.6a | 1.73:1 | 28.5c | 13.9bc | 1.80a | 88.0a | |
| 50% | 48.0c | 77.2a | 42.8a | 1.80:1 | 25.3d | 13.4cd | 1.80a | 79.4a | |
Plant growth on open quadrangle plastic containers condition
The growth and development of 1st-year bellflowers cultured on quadrangle plastic containers was lower than that of control. Moreover, survival rate of control was higher than that of water treatment section (Table 4). This growth inhibitions on water supplied sections are resulted in the late transplanting of the seedlings that leads drought of bed soil surface before root set of the seedlings. Branch number was increased by increasing soil moisture (not shown data), and it is the same result that appeared in the farmland soil condition. In case of other plant controlling for optimal content of soil moisture is very important to produce good quality of ginseng seedling (Lee et al., 2008). Because soil moisture could mitigate plant death by high air temperature and extreme drought in the open field.
Table 4.
Characteristics of growth and development of bellflower (Platycodon grandiflorum) with 1st-year cultivation at quadrangle plastic containers (760 × 470 × 190 ㎣) by automatically controlled soil water gradients
|
Plant Height (㎝) |
Leaf Length (㎜) (A) |
Leaf Width (㎜) (B) |
Leaf Length/ Leaf Width (A/B) | SPAD Value |
Diameter of Main Stem (㎜) |
Survival No./ Planting No. | Survival rate (%) | ||
| Control |
12.3bz | 21.0c | 10.3c | 2.03:1 | 18.2b | 2.50b | 13/36 | 36.1 | |
| Water cont | 20% | 10.7b | 18.3c | 12.0bc | 1.53:1 | 24.8a | 3.20b | 6/36 | 16.7 |
| 30% | 17.0a | 26.7b | 14.3b | 1.86:1 | 17.8b | 2.80b | 5/36 | 13.9 | |
| 40% | 10.7b | 19.3c | 10.3c | 1.87:1 | 12.3c | 2.60b | 9/36 | 25.0 | |
| 50% | 16.3a | 36.3a | 19.3a | 1.88:1 | 18.4b | 3.79a | 10/36 | 27.8 | |
In this study, we have constructed an automatic soil moisture control system and measured soil moisture content, and evaluated plant growth and development of bellflower. This result will be contribute to control precise water supply on farmland auto-irrigation system.
