

Introduction
Materials and Methods
Chemicals
Samples
Roasting
Colour
Weight loss
Extraction
Bioacitive compounds analysis
Antioxidant activity analysis
Statistical analysis
Results and Discussion
Colour and weight loss
Caffeine and chlorogenic acid determination
Amino acids determination
DPPH radical scavenging activity
ABTS radical scavenging activity
Reducing power
Total phenolic compounds
Introduction
Coffea arabica and C. robusta are the most important species for commercial cultivation. By the end of October 2016, Arabica coffee exports amounted to 71.93 million bags whiles Robusta coffee amounted to 40.46 million bags (ICO, 2016). Coffee is a rich source of compounds with antioxidants properties, chlorogenic acids, polyphenols, alkaloids, caffeine and amino acids. The quantities of these compounds mainly depends on the variety and origin of the plant (Belay et al., 2008; Chu et al., 2007; Stalmach et al., 2006). Chlorogenic acids are the main phenolic compounds in coffee which play a role in its bitter taste (Leloup et al., 1995). Green coffee bean contains the largest amounts of chlorogenic acids (CGA) found in plants which is about 5–12 g/100 g (Farah and Donangelo, 2006). A study of these compounds has revealed their pharmacological properties such as reduction of cardiovascular disease, diabetes type 2, and Alzheimer's disease (Lindsay et al., 2002), antibacterial and anti-inflammatory activities (Almeida et al., 2006), inhibition of the HIV-1 integrate (Robinson et al., 1996) and antispasmodic activity (Trute et al., 1997). Roasting is the most important factor in the processing of coffee into high quality beans that develops color and intricate flavors which enhances the taste of coffee beverage (Franca et al., 2005). Complex physical and chemical changes occur during roasting and the major ones are decreases in protein, amino acids, arabinogalactan, reducing sugars, trigonelline, chlorogenic acid, sucrose, water and the formation of melanoidins. It has been reported that in medium roasts, 60% loss of CGA has been observed and up to 100% losses in dark roast (Clifford, 1979; Trugo and Macrae, 1984). A lot of research has been conducted on coffee, however, data on the effects of different roasting conditions on bioactive substances (Amino acid, caffeine and chlorogenic acid) and antioxidant activity compared in IC50 of Coffea arabica and C. robusta coffee is sparingly low. The objective of this research work is to study the effects of roasting on the capacity and presence of bioactive substances such as phenolic compounds, amino acids, chlorogenic acids, caffeine and antioxidant activity in green and roasted coffee beans of Coffea arabica and C. robusta under Medium-Light, Medium and Medium-Dark roasting conditions and also find optimum roasting condition for the highest quantitative presence of bioacitive compounds and antioxidant capacity of both varieties.
Materials and Methods
Chemicals
Standards of 3-Caffeoylquinic acid (3-CQA), Caffeine, DPPH (2,2-diphenyl-1- picrylhydrazyl), Folin–Ciocalteu reagent, Na2Co3, ABTS (2,2-azinobis-3 ethyl benzothiazoline-6-sulphonic acid), Tris (hydroxy methyl) aminomethane, HCl, Phosphate buffer, Ferric chloride (Fecl3), EDTA, Potassium ferricyanide (K2Fe(CN)6), Trichloroacetic acid (TCA), Potassium persulfate, Pyrogallol, Ascorbic acid and Gallic acid were obtained from Sigma-Aldrich Co. (St. Louis, MO, USA). Standards and reagents used in the analysis were of analytical grade.
Samples
Year 2015 harvest of Coffea arabica from Guatemala and C. robusta from India which was used for this research work were purchased from M.I. Coffee crop (Seoul, South Korea).
Roasting
The two varieties of green coffee bean samples were roasted in a Commercial gas coffee roaster (Model OKS-1.5, Ozturkbay, Turkey) operating at the maximum temperature of 220℃. Roasting time was from 11 to 13 minutes to obtain Medium-Light (11 min), Medium (12 min) and Medium-Dark (13 min) roasting degree using (Perrone et al., 2012a) with some modifications.
Colour
The colour of the coffee samples was measured using Colorimetric measurements from a Chromameter Ultra Scan XE colorimeter (Hunter Lab, USA) and the procedure of Bicho et al. (2012) with some modifications. The parameters of L* (lightness), a* (green to red), b* (blue to yellow) and △E (Total colour differences) of Hunter Lab was used to examine colour. The equipment was previously calibrated against a white colour standard. According to Somporn et al. (2011), the value of L* (Lightness) indicated an interference in the roasting condition.
Weight loss
The percentage weight losses of roasted coffee samples were calculated using the following equation:
| $$Weightloss\;(\%)\;=\;100\;=\;\frac{ACRW\times100}{BCRW}$$ |
Where
ACRW = After Coffee Roasting Weight
BCRW = Before Coffee Roasting Weight
Extraction
Using Hanil HMF-326-S (South Korea) electronic grinder, green (GB) and roasted coffee beans samples (ML: Medium Light, ME: Medium, ML: Medium Dark) were grinded and sieved with a 0.0600 mm sieve. According to modification of Shimoda et al. (2006), extraction of each sample was done in a 250 ㎖ erlenmeyer flask with 10 g of ground coffee suspended in 100 ㎖ (1:10, w/v) of 70% ethanol (w/v). The mixture was then shaken at 60℃ for 2 hr. The extraction was repeated 3 times. Filtration of the mixture was carried out using Whatman filter paper No.2. The obtained extract was concentrated using a rotary evaporator under reduced pressure in a water bath set at 40℃ (Eyela N-1000, Tokyo Rikakikai, Japan). Excess solvent was removed by a freeze-dryer (PVTFD20R, Ilshin, S. Korea). The residual material was weighed and the extraction yield of each sample was calculated. The dried powder of coffee extraction was stored at -20℃ until use.
Bioacitive compounds analysis
Caffeine and chlorogenic acids analysis
Caffeine and chlorogenic acid were detected using the procedure described by Coelho et al. (2014) with modification. Caffeine and CGA contents were analyzed using by HPLC (Waters 2695, Waters, USA) with injection of 10 ㎕ of the sample on a reverse-phase HPLC C18 column (4.6 x 150 ㎜, 5 ㎛). The mobile phase consisted of purified D.W. with 5% formic acid (A) and methanol (B). The eluent program was as follows: 5% Solvent B; 0-5 min, 40% Solvent B; 5-45 min, 5% Solvent B; 45-50 min, 5% Solvent B; 50-60 min at a flow rate of 0.8 ㎖/min. Column temperature was 25℃. Caffeine and CGA in the samples were detected at UV 280 ㎚ by comparing their relative retention times. All results were expressed as g of the bioactive compound per 100 g of soluble solids in the original coffee.
Amino acid analysis
Amino acids analysis was carried as described by Schuster (1988) with modification. One ㎖ of 6 N HCl was added to 3 ㎎ of the coffee sample in 20 ㎖ capacity ampoules. This was immediately sealed after adding nitrogen gas. For acid hydrolysis, the mixture was then placed in an oven at 110℃ for 24 hr. 10 ㎖ of 0.02 N HCl was then added to the mixture and diluted with water for extraction. Filtration was done using 0.45 ㎛ membrane filter. The filtrate was then transferred into a 1.5 ㎖ reaction vial and the analysis was carried out using the Amino Acid Auto analyzer (L–8900, Hitachi, Japan). The settings for the analyses were as follows: Column: Hitachi custom ion exchange resin, 4.6 ㎜ ID ‘60 ㎜ L, Temperature 57℃. Solvent: Buffer (PH 1, 2, 3, 4 PH-RG). Elution 53 min. Detector: photometer wavelength 570 ㎜, 440 ㎜. Reaction Temperature: 135℃. Flow rate: Buffer 0.4 ㎖/ min, Ninhydrin 0.35 ㎖/ min, Injection volume: 20 ㎕.
Antioxidant activity analysis
DPPH assay
DPPH assay was performed according to the procedure described by Shen et al. (2010) with modification. One ml of various concentrations (0.125-2 ㎎/㎖) of coffee extracts and 3 ㎖ of 0.1 mM DPPH (2,2-diphenyl-2-picrylhydrazyl) dissolved in 95% EtOH (v/v) was mixed together to prepare a solution. The solution light protected by covering the beaker with aluminum foil and then stirred for 30 min in the dark room. The absorbance was measured using ELISA reader at 517 ㎚ to calculate the IC50 (㎎/㎖) of Coffee. The standard solution used was Vitamin C. The IC50 (the concentration of a substance that provides 50% reduction of free radical concentration) was determine.
ABTS assay
ABTS analysis was carried as described by Re et al. (1999) with modification. After mixing 7.4 mM ABTS stock solution with 2.6 mM potassium persulphate to form ABTS+, the solution was allowed to stand for 12-16 hrs at room temperature in the dark state for stabilization. The ABTS+ solution at 734 ㎚ was added to PBS (pH 7.4) such that the OD value was 1.4±0.10 diluted. The 500 ㎕ of various concentrations (0.125-2 ㎎/㎖) of coffee extracts was added to 1 ml ABTS+ solution and then allowed to stand in the dark room temperature for 30 min. The mixture was measured at 735 ㎚ using a UV–Vis 1240 Shimadzu spectrophotometer. Water-soluble analogue of Vitamin C was used for calibration. The Control was prepared as above without any sample. The IC50 (the concentration of a substance that provides 50% reduction of free radical concentration) was determined.
Reducing power assay
Using the procedure described by Jayanthi and Lalitha (2011) reducing power analysis was performed. 2.5 ㎖ of 0.02 M PBS buffer and 2.5 ㎖ of 1% potassium ferricynide was added to the 2.5 ㎖ of various concentrations (0.125-2 ㎎/㎖) of coffee extracts. The mixture was then placed in a water bath at 50℃ for 20 min. After cooling, 2.5 ㎖ of 10% TCA (trichloroacetic acid) solution centrifuge at 5,000 rpm for 10 min was mixed with 2.5 ml distilled water and 0.5 ㎖ of 0.1% ferric chloride solution. The absorbance was then measured at 700 ㎚ using the ELISA reader. The control was prepared in a similar manner excluding samples. The IC50 (the concentration of a substance that provides 50% reduction of free radical concentration) was determined.
Total phenolic compounds assay
The total phenolic compounds were determined by the spectrophotometric method as shown by Saeed et al. (2012). One ㎖ of sample (1 ㎎/㎖) was mixed with 1 ㎖ of Folin-Ciocalteu’s phenol reagent. 10 ㎖ of a 7% Na2CO3 solution was added to the mixture after 5 min followed by the addition of 13 ㎖ of deionized distilled water. The solution was then thoroughly mixed. The mixture was kept in the dark for 90 min at 23℃, after which the absorbance was read at 750 ㎚. The TPC was determined from extrapolation of a calibration curve which was made by preparing a gallic acid solution. The estimation of the phenolic compounds was done in triplicate. The TPC was expressed as milligrams of gallic acid equivalents (GAE) per g of dried sample.
Statistical analysis
SPSS 22 software (SPSS, Inc., Chicago, IL, USA) was used for statistical analysis. One-way ANOVA and Turkey’s test between means of more than two groups was used. All results were expressed as the means ± standard deviation. A P-value < 0.05 was considered to indicate a statistically significant difference.
Results and Discussion
Colour and weight loss
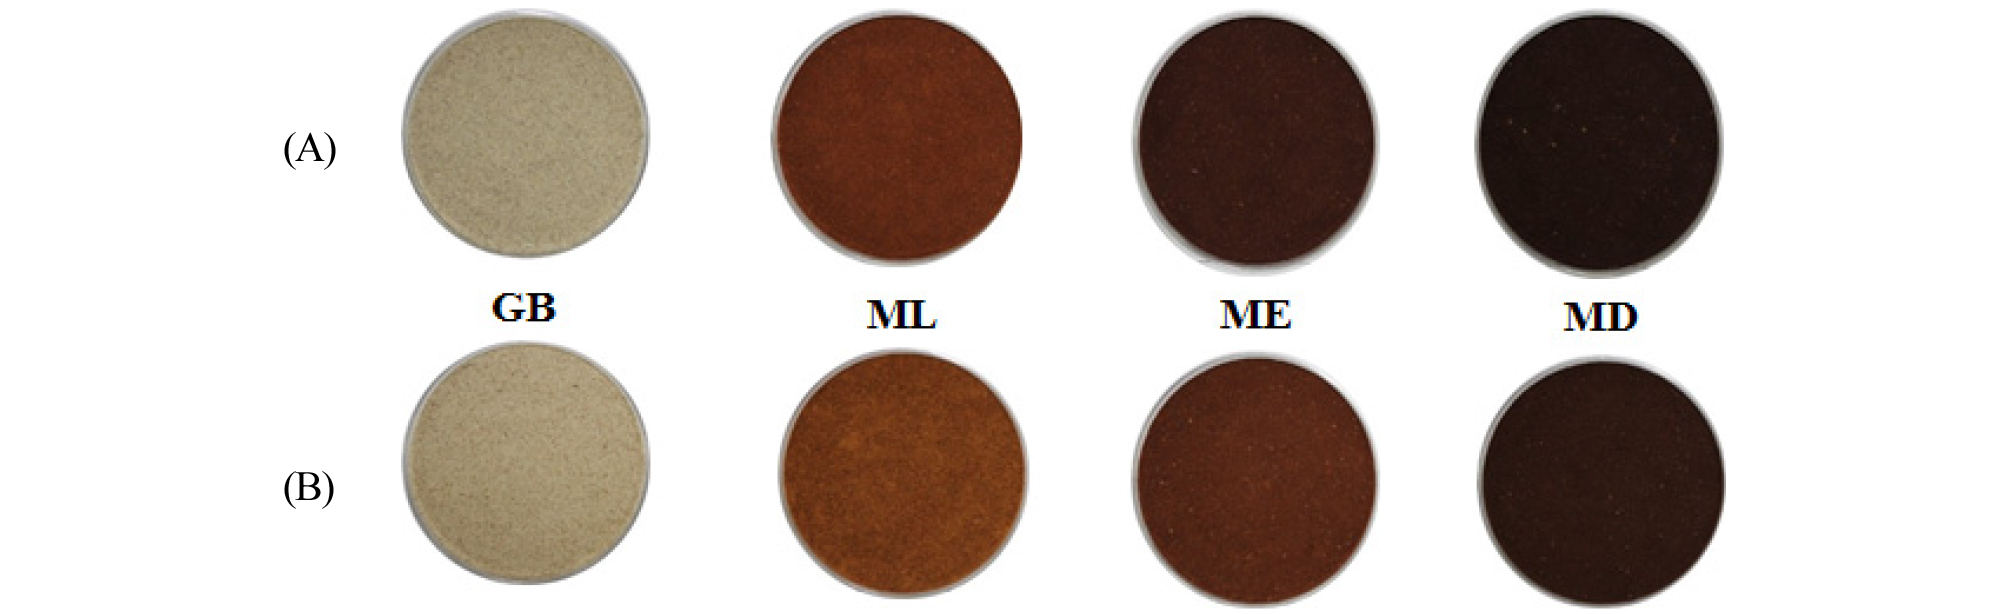
When Arabica and Robusta coffee were analyzed (Table 1), the brown pigment increases as the browning and caramelization reactions progressed. The measurements of colour was first analyzed after the process of heating. It is noted that roasted coffee beans are always classified as light, medium, and dark based on the improvement of brown colour with heating (Fig. 1). For Arabica, the value of L* and △E gradually declined with increase in the degree of roasting, b* experienced a sharp decrease in value while that of a* increased from GB (Green Bean) to ML (Medium Light) but decreased from ML to MD (Medium Dark) with roasting. In Robusta, the value of L* and △E increasingly declined with increase roasting, b* experienced a severe decrease in value while that of a* increased from GB to ML but declined with roasting from ML to MD. A sharp decrease in the degree of yellowness in coffee beans represented by parameter b* showed that it colour changed from GB to MD. During thermal processing, temperature is one of the causes of colour degradation in dehydrated products (Lozano and Ibraz, 1997). Non-enzymatic browning may not be the only cause of colour changes in coffee beans but the destruction of pigments present in it. From Table 1, the weight loss varied from 14.42% to 21.88% in ML to MD of Arabica and from 12.10% to 20.16% in ML to MD of Robusta, and the weight loss was significantly different among the roasting conditions (p < 0.05). This was expected as the loss of moisture content during roasting is significantly affected by temperature and the time. The results suggest that the degree of roasting affected the magnitude of moisture content loss in the coffee beans which also affected its weight. As reported by Wei and Tanokura (2015) further degradation could also be attributed to the higher degree of roasting, the lower L value and the result of the transformation of approximately 10% to 21% of the weight of coffee beans by the loss of a water molecule in green coffee bean.
Table 1. Colour measurements of ground Arabica and Robusta coffee under different roasting conditions
yAverage of three replicates ± standard deviation. Different superscript arabic numerals in the same subsets indicate that samples are statistically different (p < 0.05).
Caffeine and chlorogenic acid determination
The results presented show a difference in the caffeine content of both varieties which is consistent with the fact that generally Robusta beans have 40-50% more caffeine content than that of Arabica. From Table 2, caffeine in ME Robusta samples (12.72 g/100 g) is highest and lowest in GB samples (8.73 g/100 g). Similarly, caffeine in ME (Medium) Arabica samples (8.11 g/100 g) is highest and GB samples (4.56 g/100 g) lowest. The distinction in caffeine content is largely due to variety differences. The caffeine content, reaches a maximum at ME roasting condition in both varieties and then significantly decreased with further roasting contrary to current literature which shows caffeine to be heat stable during roasting but is lower quantitatively in dark roasts than in lighter roasts due to sublimation and loss at very high temperatures (Hecimovic et al., 2011). From Table 2, chlorogenic acid in GB Robusta samples is highest but reduces after increasing roasting time and temperature. Significant difference exists between the samples of Robusta from Table 2. Similarly GB Arabica samples is highest and MD samples lowest in chlorogenic acid content (Table 2). Comparing the two coffee varieties from Table 2, Robusta samples in general has the highest CGA content and the samples are significantly different. The results from Table 2 confirms that green coffee beans hold the largest quantity of CGAs in plants, at approximately 6-12% (dry basis) (Farah et al., 2005a). Another factor that can account for CGA losses due to roasting degree changes could be the incorporation of CGAs into melanoidins as proposed by Perrone et al. (2012b). Further degradation could also be the result of the transformation of approximately 30% of the CGAs into their corresponding chlorogenic acid lactones by the loss of a water molecule from quinic acid moiety as reported by Farah et al. (2005b). Losses in CGA with increasing temperature can be accounted for by the hydrolysis of chlorogenic acid into caffeic and quinic acid that later degrades into various volatile chemicals as proposed by Moon and Shibamoto (2010).
Table 2. Assessment of caffeine and chlorogenic acid content in Arabica and Robusta under different roasting conditions
yAverage of three replicates ± standard deviation. Different superscript arabic numerals in the same subsets indicate that samples are statistically different (p < 0.05).
Amino acids determination
Though not fully comprehended to date maillard reaction begins with the reaction between reducing carbohydrates and amino acids, peptides and proteins which contain free amino groups. The reaction has been proven to occur in coffee roasting because the quantitative levels of carbohydrates and amino acids or proteins are significantly reduced (Illy and Viani, 1998). The amino acids of GB, ML, ME and MD were determined by HPLC analysis and quantitative levels of seventeen selected amino acids were analyzed. Individual amino acids levels were expressed in peaks. From Table 3, Robusta in general has the highest amino acid. From GB to MD, total amino acid is 69.01 ㎎/g to 55.24 ㎎/g highest in GB samples. Similarly in Arabica, total amino acid is 55.42 ㎎/g to 47.66 ㎎/g highest in GB samples. After roasting to MD approximately 14% and 20%, loss of total amino acids is observed in Arabica and Robusta, respectively. Glutamic acid is highest in ME samples of both coffee varieties, and in Arabica it increased by 14% after roasting from GB to ME. However, approximately 3.8% increase occurred in Robusta. Histidine, aspartic acid, arginine, threumine, proline, serine, emthionine, lysin and alanine decreased in both varieties with each change in roasting conditions. With an increase in the roasting condition, phenylalanine (13.49%), Leucine (11.24%), Valine (11.05%), Tyrosine (10.4%), Isoleucine (4.4%) and Glutamic acid (3.8%), in Robusta increased to a maximum at ME roast condition above which they evidently reduced. In Arabica, glycine (64.84%), tyrosine (15.54%), glutamic acid (14%), phenylalanine (13.19%), leucine (11.83%), valine (11.05%) and isoleucine (2%) behaved similarly as in Robusta. From the results presented there is a general decrease in the total amount of individual amino acids with increased roasting degree. Green coffee, however, has the highest content of all amino acids. In green coffee, proteins make up approximately 8.5 to 12% (dry basis) (Montavon et al., 2003). Since amino acids are the building components of proteins, a loss in proteins implies a loss of amino acids too. During roasting, approximately 21% of proteins are lost due to their involvement in maillard reaction (Bekedam, 2008). From the results, there is a build-up of some of the amino acids and this may be the result of transamination during the maillard reaction. However, the build up may not be large enough to conclude on that basis. Proteins that are associated with melanoidins have a high concentration of aspartic acid, glutamic acids, alanine and glycine. This proves that some amino acids are utilized during maillard reaction to form melanoidins.
Table 3. Assessment of amino acid (㎎/g) contents in Arabica and Robusta under different roasting conditionsz
yAsp Aspartic acid, Thr Threonine, Ser Serine, Glu Glutamic acid, Gly Glycine, Ala Alamine, Cys Cystine, Val Valine, Met Methionine, Ile Isoleucine, Leu Leucine, Tyr Tyrosine, Phe Phenylalanine, Lys Lysine, His Histidine, Arg Arginine, Pro Proline.
xAverage of three replicates ± standard deviation. Different superscript arabic numerals in the same subsets indicate that samples are statistically different (p < 0.05).
DPPH radical scavenging activity
From Table 4, DPPH in IC50 of Robusta coffee ranks ML samples highest and MD samples lowest. Within Robusta samples, there are no significant differences between GB and ML samples but significant differences exist when compared to the other samples as shown in Table 4. Similarly in Arabica ML samples is highest and MD samples lowest. Within Arabica samples, there are no significant differences between GB and ME, however, significant difference exists amongst the other samples. Comparing the two coffee samples from Table 4, Robusta samples in general have the highest 50% inhibitory and both of Arabica and Robusta coffee increased 50% inhibitory slightly in the ML roasted sample and decreased after increasing roasting conditions. DPPH compound has a stable free radical with an absorption at 517 ㎚. Antioxidant interaction with DPPH results in the transfer of an electron or hydrogen atom to DPPH, thus neutralizing its free radical character. The degree of discolouration shows the scavenging potential of the antioxidant sample (Muschler 2001). From the data, the inhibitory effects of coffee increased with a slight increase in roasting degree from GB to ML. This indicates the formation of low molecular weight phenols during moderate heating (Montavon et al., 2003). Increasing roasting conditions reduces the quantity of phenolic compounds. This is the result of polymerization or autoxidation reactions (Nunes and Coimbra, 2001) which may results in the formation of compounds with less antioxidant properties.
Table 4. Antioxidant activity of Arabica and Robusta coffee extracts with different roasting conditions evaluated by four analytical methods
yIC50 values (㎎/㎖) were defined as the concentration at 50% inhibition of biological activity.
xTPC value present by ㎎GAE/g.
wAverage of three replicates ± standard deviation. Different superscript arabic numerals in the same subsets indicate that samples are statistically different (p < 0.05).
ABTS radical scavenging activity
The IC50 of ABTS in Robusta coffee from Table 4 ranks ML samples highest and ME or MD samples lowest. Within Robusta there are no significant differences between ME and MD samples but significant difference exists when compared to the other samples. Similarly in Arabica ML samples is highest and GB samples lowest. Within the Arabica samples, there is no significant difference between ME and MD, however, significant difference exists among the other samples. Comparing the two coffee varieties from Table 4, Robusta samples in general have the highest 50% inhibitory effect and both of Arabica and Robusta coffee increased 50% inhibitory slightly in the ML roasted sample but decreased after increasing roasting conditions. The changes in the antioxidant properties under varying roasting conditions implies that prolonged roasting at high temperatures would cause a change in the antioxidant capacity of coffee. The increasing temperature may result in degradation of the phenolic compounds which are linked to the antioxidant properties of coffee.
Reducing power
From Table 4, IC50 of reducing power in Robusta coffee ranks GB samples highest and MD samples lowest. There is significant difference between the samples of this coffee variety and roasting conditions from Table 4. Similar comparison in Arabica ranks GB samples highest and MD samples lowest. Within the Arabica samples, there are no significant differences between GB and ML as well as ME and MD. Comparing the two coffee varieties from Table 4, Robusta in general has the highest inhibitory effect after increasing roasting conditions. It is assumed that the antioxidant capacity is equal to the reducing capacity which is high in GB of the two coffee varieties used for the research. The ferric ion reducing antioxidant power (FRAP) assay is a non-specific, redox linked, colorimetric assay that is related to the molar concentration of the antioxidant present.
Total phenolic compounds
The total phenolic compounds of the coffee samples are determined using the Folin-Ciocalteu method with gallic acid as the standard in the in-vitro analysis. From Table 4, GB samples of Robusta have the highest measure of total phenolic compounds and MD samples have the lowest. In Arabica, total phenolic compounds is highest in ML whiles MD samples have the lowest content. Generally, the total phenolic content of the coffee samples reduced with increasing roasting conditions and GB of Robusta recorded the highest among the two varieties. The difference in total phenolic content of both varieties can mainly be attributed to varietal differences. Since the most abundant phenolic compounds in coffee are CGAs, changes in their quantitative levels due to roasting can significantly affect the total phenolic compounds. In roasted coffee, CGAs are temporally isomerized and decomposed due to the application of heat (Trugo and Macrae, 1984; Zanoelo and Beninća, 2009; Dawidowicz and Typek, 2010; Dawidowicz and Typek, 2011). The decrease in phenolic content with increasing roasting degree confirms the report that in more heavily roasted coffee beans CGA content decreases with increasing roasting degree (Farah et al., 2005c). The initial increase in the total phenolic compounds in Arabica could however be attributed to the formation of chlorogenic lactones (CGL) due to relatively lower roasting degrees as reported by Ferah et al. (2005d) whose investigations showed a maximum increase in the CGLs with light-medium roasting but decrease with further roasting of Coffea arabica. Comparing both varieties, Robusta in general has the highest measure of the total phenolic compounds. Phenolic compounds of both varieties however decreased after increasing roasting conditions. Phenolic compound in coffee are known to possess antioxidant properties. However, the main phenolic compounds in green coffee are chlorogenic acids which are formed by the esterification of quinic acid and trans-cinnamic acid derivatives. Since phenolic compounds are linked to antioxidants and roasting causes the degradation of phenolic compound in coffee it is logical to imply that the antioxidant activity are also negatively affected by elevated temperatures. Though roasting generally degrades phenolic compounds, other phenolic compounds are believed to be formed as a result of maillard reaction which contributes to the antioxidant activity in coffee. The GB Robusta shows the highest levels of activity in antioxidant assays because this coffee variety has the largest content of chlorogenic acids in their green state.
Roasting has over the years proven vital in the processing of coffee. Studies on roasting have revealed so many potentials of coffee as a good source of bioactive compounds for healthy living. From this study Robusta has the highest quantity of bioactive active compounds and antioxidant activity. The results showed that the optimal roasting condition for coffee is ME above which there is a distinct reduction of bioactive compounds and antioxidant activity. In vivo studies and specific physiology of Robusta coffee is recommended to develop a highly functional active drug. The studies can also prove whether there is a correlation between the oxidative stress and the consumption of high potent antioxidants food products.
