

Introduction
Materials and Methods
Plant materials and cultivation
Recording of agronomic traits
Statistical Analysis
Results
Comparative analysis of agronomic traits in foxtail millet
Distributional variations in qualitative traits of foxtail millet
Contribution and correlation analysis of agronomic traits using PCA
Correlation and hierarchical clustering analysis of agronomic traits
Discussion
Introduction
Foxtail Millet (Setaria italica L.) is a resilient crop that thrives in arid climates and poor soils, making it an important food resource in Asia, Africa, and some parts of Europe (Yadav et al., 2021). In Korea, foxtail millet has been cultivated for centuries, reflecting the ecological and agricultural characteristics of various regions (Goron and Raizada, 2015). These foxtail millet landraces possess significant agronomic traits, driven by their genetic diversity and environmental adaptability, making them valuable for both utilization and conservation (Dipnarayan Saha et al., 2016).
Foxtail millet has garnered attention as a crop capable of adapting to shifting agricultural environments (Muthamilarasan and Prasad, 2021). Global research on foxtail millet has intensified in recent years, focusing on its agronomic trait diversity and conservation (Sood et al., 2019). However, there is a relative lack of systematic studies on the agricultural characteristics of foxtail millet collected from Korea. Given Korea’s diverse geography, there is likely substantial regional variation in foxtail millet genetic resources. Understanding this regional diversity is critical not only for evaluating foxtail millet's agricultural potential but also for research on propagation and conservation (Kim et al., 2024; Lee et al., 2021; Vetriventhan et al., 2020).
In this study, analyzed total of foxtail millet landrace germplasm collected from various regions across Korea and China were analyzed using a total of fifteen agronomic traits (both quantitative and qualitative). The variation of the agronomic traits with regard to regional differences was also investigated. Additionally, chi-square test was used to analyze the regional distribution differences of qualitative traits, while the association between the analyzed traits was assessed using Pearson’s correlation coefficient values. Principal component analysis (PCA) was performed to identify the major factors explaining variations observed. Overall, this study elucidated the agricultural characteristics and regional diversity of Korean and Chinese foxtail millet landraces, providing foundational data for future conservation efforts and strategic breeding programs.
Materials and Methods
Plant materials and cultivation
The foxtail millet landraces from Korea and China used in this study were newly collected accessions that were propagated and subsequently evaluated for agronomic traits. Foxtail millet accessions were systematically collected from three distinct latitudinal zones in Korea: the northern region (Gangwon-do, Gyeonggi-do, number of accessions (n) = 14), the central region (Chungcheongbuk-do, Chungcheongnam-do, n = 19), and the southern region (Gyeongsangbuk-do, Gyeongsangnam-do, Jeollanam-do, Jeju-do, n = 7). These accessions were compared with four established foxtail millet cultivars to assess regional trait variation. Additionally, nine accessions were collected from China to provide a broader geographical comparison. All foxtail millet seeds used in this study were obtained from the National Agrobiodiversity Center (NAC), Rural Development Administration (RDA, Jeonju, South Korea). The seeds were propagated in the experimental field located at NAC. The foxtail millets were sown on May 31, 2022 and transplanted to the main field on June 21 of the same year, where the basic agronomic traits were investigated.
Recording of agronomic traits
For each accessions, a total of seven qualitative and eight quantitative traits, including days to flowering (DTF), days to maturity (DTM), number of branches (NB), panicle length (PL), panicle width (PW), culm length (CL), stem thickness (ST), 1,000-seeds weight (SW), initial growth (IG), plant type (PT), leaf color intensity (LCI), panicle shape (PS), stay-green trait (SGT), seed coat color (SCC), and leaf shape (LS), were evaluated. DTF was recorded as the number of days from sowing to the date when more than 50% of panicles emerged in one plant. DTM was measured as the number of days from sowing to when about 80% of the plant's panicles had blackened at the base. NB was determined by counting the number of branches formed on the main stem. PL was measured as the length of the panicle, and PW was recorded as the width of the widest part of the panicle. CL was measured from the ground to the base of the panicle after DTF, while ST was measured as the thickness between the first and second internodes. The weight of 1,000 fully mature seeds was measured for SW.
With regard to qualitative traits, IG was evaluated as vigorous or poor, while PT was categorized as upright or intermediate. LCI was assessed as absent (A), moderate (M) or strong (S). Similarly, PS was categorized as conical (CO), spindle-shaped (SP), cylindrical (CY), club-shaped (CS), terminal branched (TB), or fully branched (FB). SGT was evaluated as S, or M. SCC was classified into light green (LG), yellow (YE), brown (BR), purple (PU), others (OT), or mixed (MX). LS was categorized into broad and long leaves (BL), broad and short leaves (BS), intermediate (IN), narrow and short leaves (NS), or narrow and long leaves (NL).
Statistical Analysis
The correlations among foxtail millet agronomic traits were analyzed using Pearson’s correlation coefficient values and used to evaluate the relationships between traits. PCA was used to simplify multivariate data and visually assess variation among accessions. A chi-square test was performed to analyze the regional distribution differences of qualitative traits, and the results were visualized using mosaic plots. All data were collected in triplicate or repeated 10 times, and results were expressed as the mean ± standard deviation. Statistical analyses, including analysis of variance (ANOVA), PCA, Pearson correlation, and mosaic plots, were conducted using R software Version 4.3.2 (R-Studio, Boston, MA, USA).
Results
Comparative analysis of agronomic traits in foxtail millet
Table 1 present the variations of quantitative agronomic traits across three groups of foxtail millet. Group A compared the difference among accessions collected from different latitudinal regions in Korea, including the northern, central, and southern areas. In group B, the variation among Korean landraces and cultivars was compared. Likewise, landraces of foxtail millet from Korea and China were compared in group C.
In each group wide differences were observed. In Group A, DTF, PL, ST, and SW showed significant variations, while the other traits remained unaffected by regional difference. Accordingly, accessions collected from the southern region exhibited delayed DTF, longer PL, thicker ST, and heavier SW compared to accessions from the northern and central regions. In group B, only PL showed a significant variation and it was longer in cultivars compared to landraces. Regarding Group C, only DTF and ST showed significant variations. Specifically, Korean landraces had a longer DTF and a thicker ST than Chinese landraces.
Table 1.
Comparison of quantitative agronomic traits for foxtail millet germplasm across group.
| Traitz | Group A | Group B | Group C | ||||
| Northern | Central | Southern | Landrace | Cultivar | Korea | China | |
| DTF | 57.4±9.0b | 58.5±7.4b | 66.1±9.1a | 59.5±8.7a | 65.3±3.0a | 59.5±8.7a | 47.8±7.9b |
| DTM | 115.9±11.7a | 117.5±10.5a | 124.3±8.8a | 118.1±10.9a | 128±6.6a | 118.1±10.9a | 111.2±10.2a |
| NB | 4.0±2.6a | 3.4±1.4a | 3.0±1.3a | 3.5±1.9a | 3.8±1.0a | 3.5±1.9a | 2.7±1.4a |
| PL | 24.5±3.4b | 25.9±5.2b | 30.5±7.1a | 26.2±5.3b | 32.1±4.4a | 26.2±5.3a | 22.5±4.7a |
| PW | 29.1±4.4a | 28.1±4.6a | 25.9±4.6a | 28.1±4.5a | 28.6±2.0a | 28.1±4.5a | 25.9±5.1a |
| CL | 120.5±31.1a | 134.0±19.4a | 136.4±27.6a | 129.7±25.7a | 136.2±14.0a | 129.7±25.7a | 121.2±22.2a |
| ST | 9.2±1.5b | 9.2±1.0b | 11.1±3.2a | 9.5±1.8a | 10.4±2.0a | 9.5±1.8a | 7.7±0.9b |
| SW | 2.9±0.6b | 2.7±0.5b | 3.3±1.1a | 2.9±0.7a | 2.8±0.5a | 2.9±0.7a | 2.9±0.3a |
Distributional variations in qualitative traits of foxtail millet
The chi-square test revealed significant differences in several traits across the three groups at different levels of significance (Table 2). In group A, a significant difference was found in PS (p-value = 0.02. In Group B, LCI showed a highly significant difference (p-value = 0.00). Additionally, Group C had significant differences in SCC (p-value = 0.01) and LS (p-value = 0.00).
Table 2.
Chi-square test results for the relationship between variables in foxtail millet germplasm.
| Groupz | Variable | Chi-square (X2) | df | p-value |
| A | Initial growth | 0.75 | 2 | 0.69 |
| Plant type | 6.08 | 2 | 0.05 | |
| Leaf color intensity | 4.84 | 2 | 0.09 | |
| Panicle shape | 20.64 | 10 | 0.02* | |
| Stay green trait | 4.84 | 2 | 0.09 | |
| Seed coat color | 11.76 | 10 | 0.30 | |
| Leaf shape | 5.80 | 6 | 0.45 | |
| B | Initial growth | 0.00 | 1 | 0.94 |
| Plant type | 0.00 | 1 | 1.00 | |
| Leaf color intensity | 24.14 | 2 | 0.00** | |
| Panicle shape | 6.69 | 5 | 0.24 | |
| Stay green trait | 0.00 | 1 | 1.00 | |
| Seed coat color | 0.63 | 5 | 0.99 | |
| Leaf shape | 2.28 | 3 | 0.52 | |
| C | Initial growth | 0.00 | 1 | 0.98 |
| Plant type | 1.95 | 1 | 0.16 | |
| Leaf color intensity | 0.00 | 1 | 1.00 | |
| Panicle shape | 5.22 | 5 | 0.39 | |
| Stay green trait | 0.00 | 1 | 1.00 | |
| Seed coat color | 15.37 | 5 | 0.01* | |
| Leaf shape | 17.44 | 4 | 0.00* |
zGroup A: Comparison of qualitative traits in foxtail millet across different latitudinal regions in Korea, Group B: Comparison of qualitative traits between landraces and cultivars of foxtail millet in Korea, Group C: Comparison of qualitative traits between foxtail millet landraces from Korea and China. df: degrees of freedom. **p < 0.01, *p < 0.05.
Based on these findings, the distribution of qualitative traits across groups was visualized using mosaic plots (Fig. 1). Mosaic plots provide a visual representation of the distributional differences in traits across categories. Each rectangle in the plot represents the relative proportion of a specific trait within a given category, with larger rectangles indicating a higher proportion of that trait in the corresponding category.
Fig. 1A shows that among the foxtail millet accessions collected from northern and central regions, the CS of PS was the most prevalent, followed by CO and club-distributed forms, respectively. Notably, FB forms were only observed in accessions from the northern region, while TB forms were exclusive to accessions collected from the southern region. Fig. 1B illustrates that while the cultivar group of foxtail millet exhibited a more even distribution of the M and S forms of LCI, the landrace group was predominantly distributed with the A form, with no observations of the M trait. Fig. 1C highlights that only Korean foxtail millet accessions exhibited an LG color of SCC, while the NS form of LS was exclusively observed in the Chinese foxtail millet accessions.
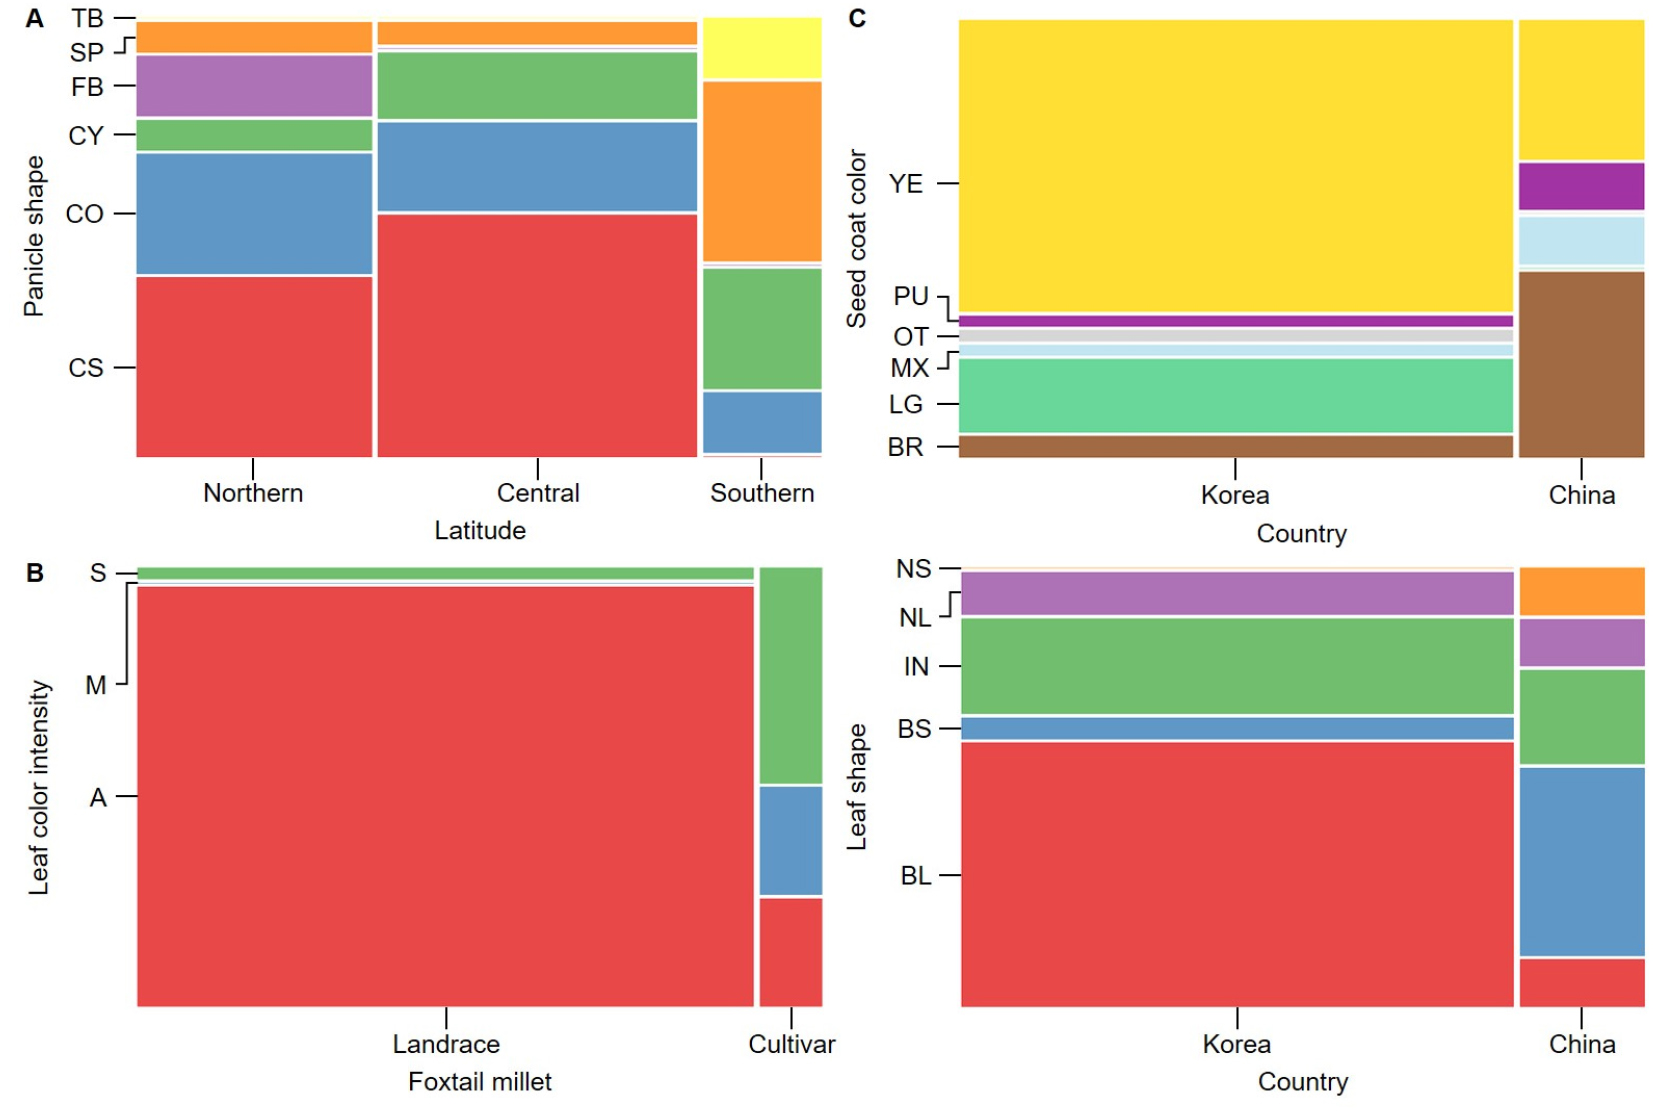
Fig. 1.
Regional differences in the distribution of qualitative traits in foxtail millet accessions using mosaic plots. The traits include leaf color intensity (LCI), panicle shape (PS), seed coat color (SCC), and leaf shape (LS). Each rectangle represents the relative proportion of a specific trait in a region, and the larger the rectangle, the higher the proportion. S: strong; M: moderate; A: absent; TB: terminal branched; SP: spindle-shaped; FB: fully branched; CY: cylindrical; CO: conical; CS: club-shaped; YE: yellow; PU: purple; OT: others; MX: mixed; LG: light green; BR: brown; NS: narrow and short leaves; NL: narrow and long leaves; IN: intermediate; BS: broad and short leaves; BL: broad and long leaves.
Contribution and correlation analysis of agronomic traits using PCA
Fig. 2A visualizes the contribution of each variable to the principal components (PC1 to PC5). The analysis revealed that 34.8% of the total variance was explained by PC1 followed by PC2 which explained 23.3%. Other components including PC3, PC4, and PC5 explained 12.3, 10.1, and 9.2%, respectively. Together, these components accounted for 89.8% of the total variance. PC1 was primarily explained by DTF, DTM, and CL, while PC2 was strongly associated with SW, ST, and NB. PC3 was closely linked to PW. Unlike these, PC4 and PC5 showed relatively weak associations with many of the variables.
In the biplot for PC1 and PC2 (Fig. 2B), arrows represent the eigenvectors of each variable, and the length of each arrow indicates the degree of contribution to the principal components. DTF and DTM pointed strongly in the same direction. The NB arrow was nearly perpendicular to PC1, indicating its low contribution to PC1. PL followed the same direction as ST and SW and showed a significant contribution. The vectors for CL and ST formed a right angle. Conversely, SW pointed in the opposite direction from CL. PW had a relatively low contribution to PC1.
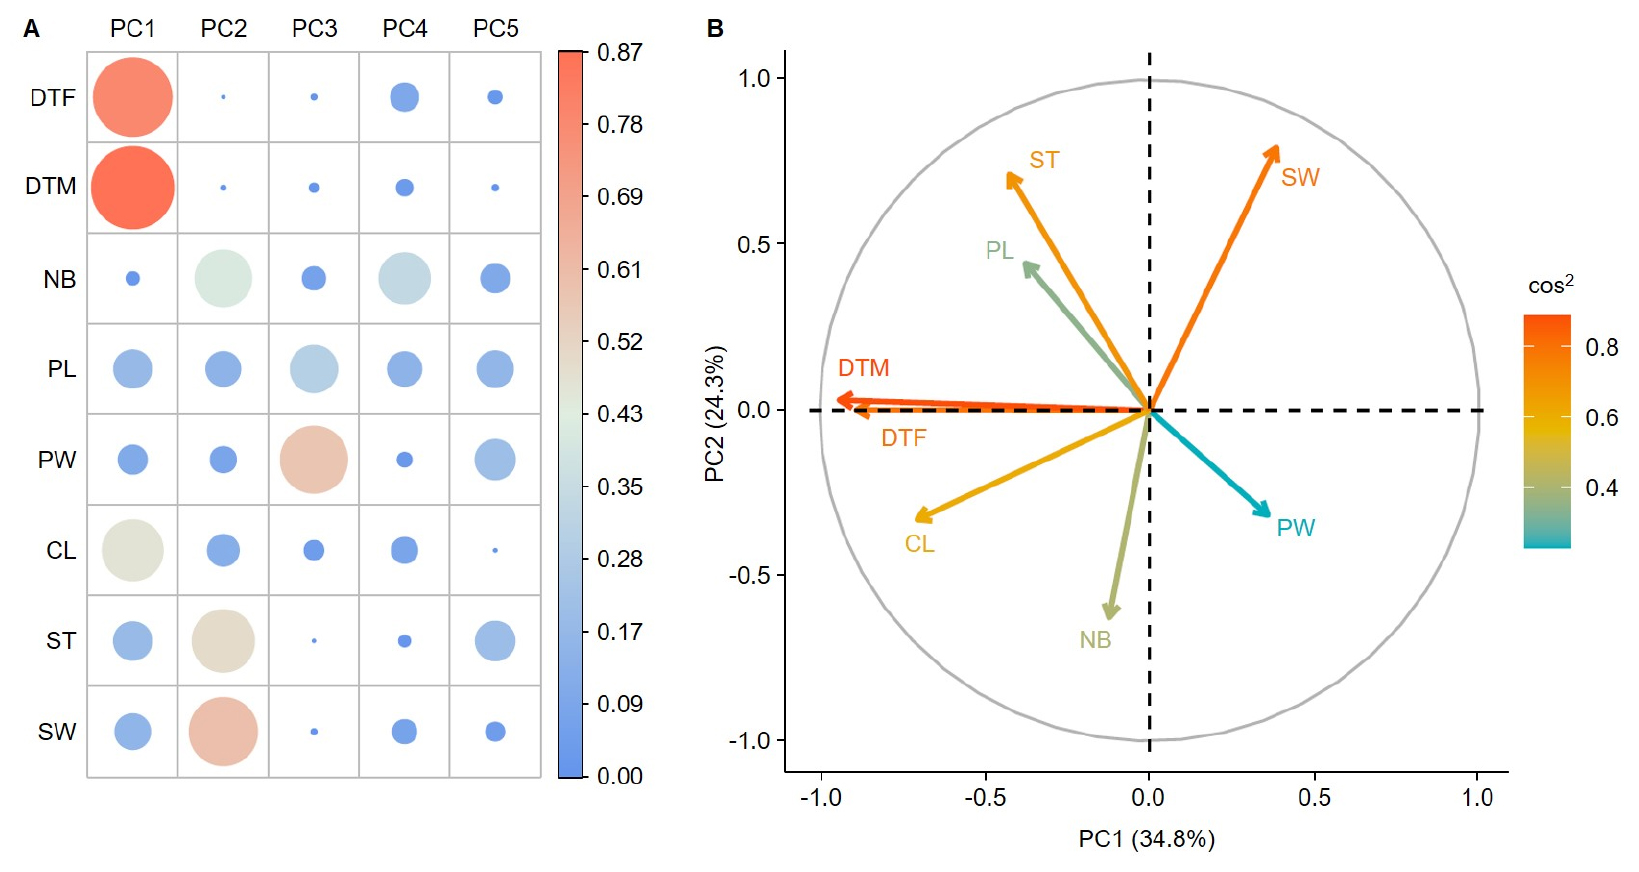
Fig. 2.
Contribution and correlation analysis of agronomic traits of foxtail millet resources using principal component analysis (PCA). (A) The contribution of each variable to the first five principal components (PC1 to PC5) is visualized. Circle size and color intensity represent the contribution of each variable, with larger circles and colors closer to red indicating a higher contribution based on the cos2 (cosine square) values. (B) A biplot showing the relationship between PC1 and PC2, with arrows representing the eigenvectors of each agronomic trait. The length of each arrow indicates its contribution to the principal components. PC1 explains 34.8% of the total variance, followed by 23.3% by PC2. DTF: days to flowering (days), DTM: days to maturing (days); NB: number of branches; PL: panicle length (㎝); PW: panicle width (㎝); CL: culm length (㎝); ST: stem thickness (㎜); SW: 1,000-seed weight (g).
Correlation and hierarchical clustering analysis of agronomic traits
quantitative agronomic traits were analyzed for foxtail millet accessions (Table 3). DTF and DTM exhibited a strong positive correlation (r = 0.88). DTF was also positively correlated with CL (r = 0.45) and ST (r = 0.37), but negatively correlated with SW (r = -0.33). Similarly, DTM was positively correlated with PL (r = 0.30), CL (r = 0.48), and ST (r = 0.41), and negatively correlated with PW (r = -0.31) and SW (r = -0.33). NB showed a negative correlation with SW (r = -0.33). PL Was positively correlated with ST (r = 0.30). CL shows a negative correlation with SW (r = -0.43). ST was positively correlated with SW (r = 0.40).
Table 3.
Correlation of quantitative agronomic traits for foxtail millet.
| Variablez | DTF | DTM | NB | PL | PW | CL | ST | SW |
| DTF | 1.00 | 0.88 | 0.01 | 0.24 | -0.19 | 0.45 | 0.37 | -0.33 |
| DTM | 1.00 | 0.08 | 0.30 | -0.31 | 0.48 | 0.41 | -0.33 | |
| NB | 1.00 | -0.17 | 0.01 | 0.29 | -0.19 | -0.33 | ||
| PL | 1.00 | -0.08 | 0.26 | 0.30 | 0.09 | |||
| PW | 1.00 | -0.05 | -0.20 | -0.08 | ||||
| CL | 1.00 | 0.08 | -0.43 | |||||
| ST | 1.00 | 0.40 | ||||||
| SW | 1.00 |
Fig. 3 visualizes the results of a hierarchical clustering analysis (HCA) of the quantitative agronomic traits in foxtail millet accessions through a heatmap. In the heatmap, green represents higher trait values, while orange represents lower values. The analysis revealed two major groups. Compared to those in Group II, Group I consisted of accessions with higher DTF, DTM, CL, and ST values. On the other hand, Group II consisted of accessions with shorter growth periods and had lower DTF and DTM values, a higher PW, and an intermediate 1000 SW. Unlike the other traits, NB did not show a clear distinction between the two groups.
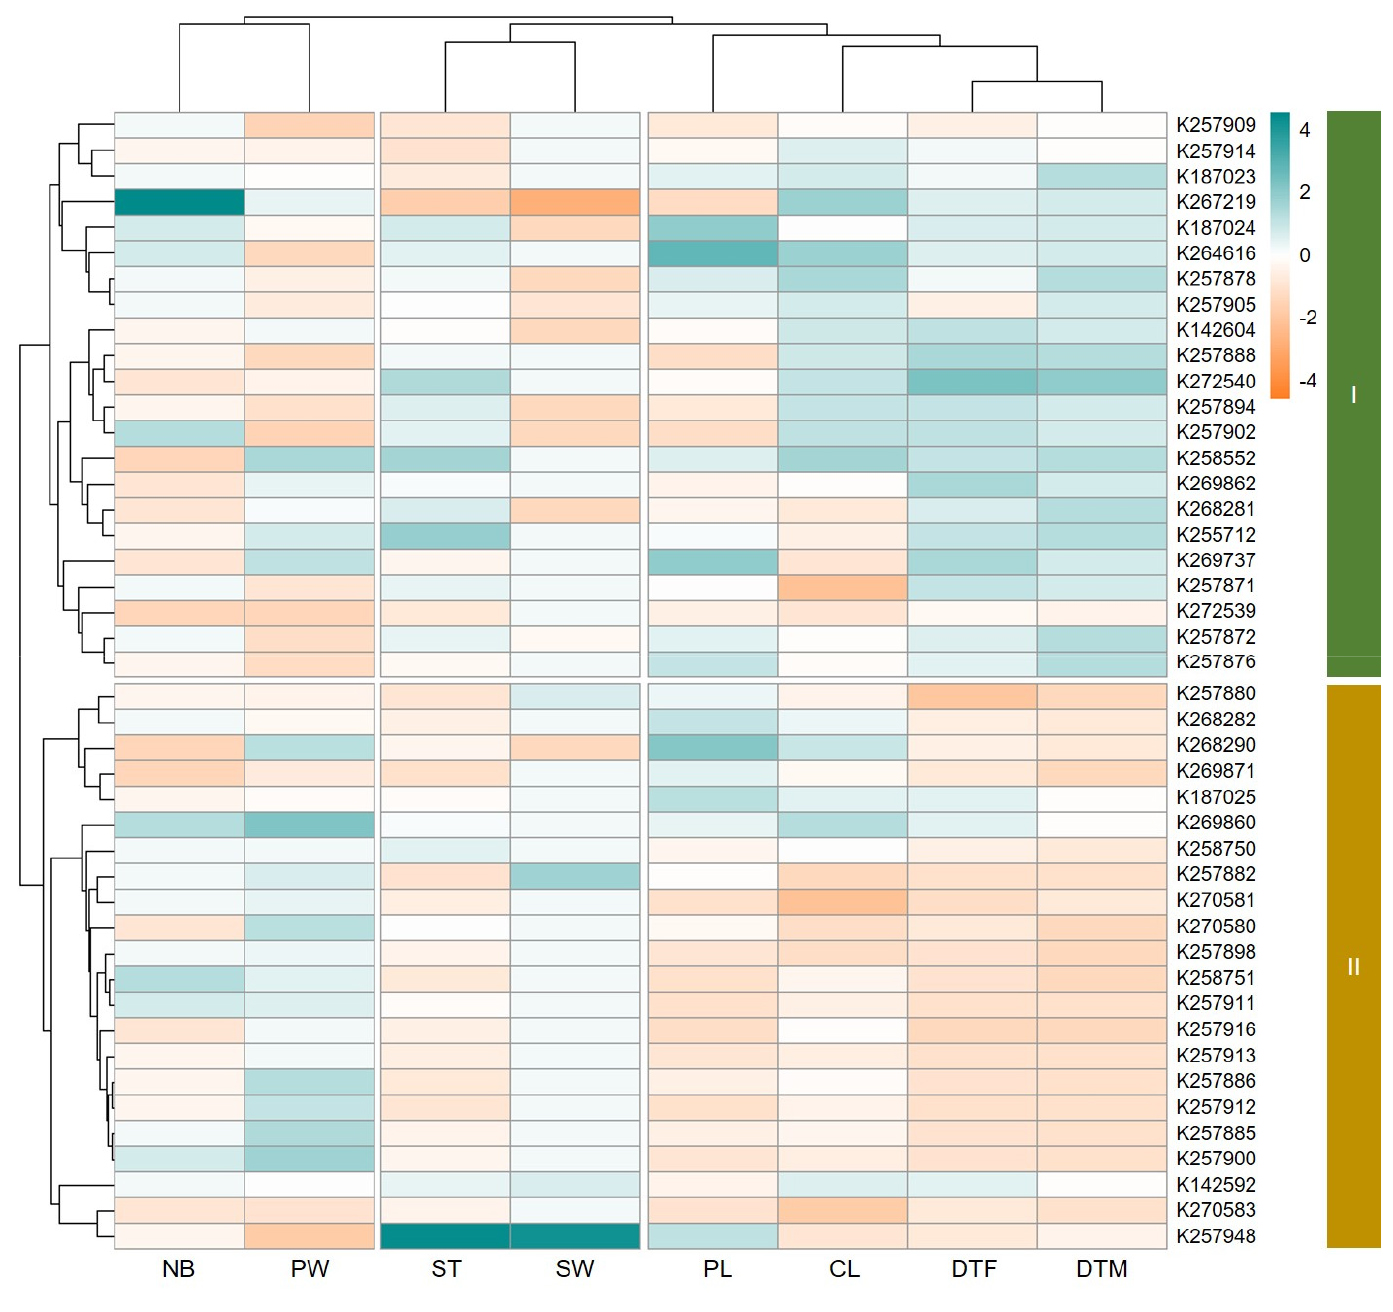
Fig. 3.
Hierarchical clustering analysis of quantitative agronomic traits in foxtail millet. Heatmap of hierarchical clustering analysis of the foxtail millet accessions based on their quantitative agronomic traits. Green colors indicate higher trait values, while orange colors indicate lower values. DTF: days to flowering (days); DTM: days to maturing (days); NB: number of branches; PL: panicle length (㎝); PW: panicle width (㎝); CL: culm length (㎝); ST: stem thickness (㎜); SW: 1,000-seed weight (g).
Discussion
This study conducted a comprehensive analysis of the correlations and regional differences in key agronomic traits of foxtail millet accessions collected from eight regions in Korea and China. Through this analysis, the relationships between quantitative traits were elucidated. Additionally, the study explored how various qualitative traits vary according to geographical regions and discussed the implications of these variations for agricultural utilization.
The comparative analysis of agronomic and qualitative traits in foxtail millet across different regions highlights the influence of local preferences on the selection and preservation of specific traits in landraces. In Group A, the delayed DTF, longer PL, thicker ST, and heavier SW observed in southern accessions, compared to those from northern and central regions, suggest that these traits have been favored by local communities over generations (Hajjarpoor et al., 2021). In Group B, the shorter PL found in landraces compared to cultivars suggests that local populations may have preferences for more compact plants that are easier to harvest or better suited to traditional farming practices. Modern cultivars have been bred for traits such as longer panicles to improve yield. However, landraces remain important for their adaptability and the specific traits they retain, reflecting the preferences of local farmers who cultivated them over time. The minimal differences in other traits between landraces and cultivars suggest that modern breeding programs have built on the foundation established by these locally preferred forms, selectively enhancing certain traits without drastically altering the overall profile of the foxtail millet (Govindaraj et al., 2020). In Group C, the longer DTF and thicker ST observed in Korean landraces compared to Chinese landraces suggest that these traits have been valued by Korean farmers and maintained through generations of cultivation. The lack of significant differences in other agronomic traits indicates that, despite geographic separation, similar selection pressures or agricultural needs may have preserved a shared core set of traits in landraces from both countries (Liu et al., 2014).
The significant distributional variations in qualitative traits highlight the influence of local preferences on foxtail millet diversity. In Group A, the observed differences in PS (p-value = 0.02) suggest that local communities favored certain forms, such as FB in the northern region and TB in the southern region, contributing to the morphological diversity. The significant difference in LCI (p-value = 0.00) between landraces and cultivars in Group B indicates that strong LCI is an important trait prioritized in modern breeding programs. Similarly, in Group C, differences in SCC (p-value = 0.01) and LS (p-value = 0.00) between Korean and Chinese landraces point to region-specific preferences driving trait selection.
The PCA results identified five principal components (PCs) that explained approximately 89.8% of the total variance. PC1 was primarily associated with traits related to the growth period, such as DTF, DTM, and CL, while PC2 was strongly linked to traits related to yield and structural characteristics, such as SW, ST, and NB. Notably, the strong positive correlation (r = 0.88) between DTF and DTM indicates a pattern where later flowering leads to later maturity. This implies that as the growth period extends, the overall growth and development of the plant increase, which can serve as an important factor in determining the optimal harvest time from an agricultural perspective (Soler et al., 2008). HCA divided the foxtail millet accessions into two main groups. Group I consisted of resources with longer DTF and DTM, as well as higher CL and ST. In contrast, Group II comprised resources with shorter growth periods and higher PW. These findings provide valuable insights for selecting cultivars that balance growth duration with productivity (Yadav et al., 2021).
The positive correlation between ST and SW (r = 0.40) is also noteworthy, as it suggests that foxtail millet with thicker stems may produce heavier seeds. This highlights the need to balance structural strength with yield potential in breeding high-yielding cultivars. In contrast, the negative correlation between CL and SW (r = -0.43) indicates that longer CL may lead to reduced seed weight, revealing a trade-off between structural traits and seed productivity (Yoon et al., 2016). This suggests that selecting accessions based on structural characteristics could help optimize both seed quality and quantity (Zhong et al., 2024). Thus, the results of HCA, PCA, and correlation analysis consistently demonstrate the relationships between traits, as evidenced by the statistical analysis.
In conclusion, this study systematically analyzed the trait variations of foxtail millet landraces, revealing that both quantitative and qualitative traits are closely shaped by regional characteristics and local selection pressures. The comprehensive analysis of correlations, PCA, HCA, and regional comparisons highlights the influence of geographic and cultural factors on trait preservation and diversification. These findings provide a valuable foundation for foxtail millet breeding programs, offering insights into the genetic and phenotypic diversity that can be leveraged to develop regionally adapted cultivars. Furthermore, the study underscores the importance of preserving landraces as reservoirs of unique traits that could enhance resilience and adaptability in modern cultivars.
