Introduction
Materials and Methods
Chemical reagents
HML preparation
Cell culture
Differentiation of 3T3-L1 cells
Oil Red O staining
Western blot analysis
Cell proliferation assay for measuring the growth of 3T3-L1 cells
Measurement of free glycerol
Statistical analysis
Results and Discussion
Effect of HML on regulation of lipolysis-related proteins in 3T3-L1 cells
Effect of HML on regulation of browning-related proteins in 3T3-L1 cells
Effect of HML on regulation of autophagy-related protein in 3T3-L1 cells
Effect of HML on proliferation of 3T3-L1 cells
Introduction
It has been reported that obesity causes metabolic diseases including hypertension, type 2 diabetes, hyperlipidemia, and cardiovascular disease (Choi et al., 2022; Jahangir et al., 2014). Moreover, obesity has been reported to increase the rates of infection and mortality due to COVID-19 (Gao et al., 2020). Thus, obesity is an emerging social problem worldwide (Seo et al., 2018).
To date, many anti-obesity drugs such as Orlistat (Xenical) and Sibutramine (Reductil) have been developed. However, it has been reported that these anti-obesity drugs cause several side-effects and thus have limitations to their consumption (Gamboa-Gómez et al., 2015). Therefore, recent research has focused on medicinal plants that have no side-effects for treatment of obesity (Gamboa-Gómez et al., 2015).
Hibiscus manihot (HML) (syn.: Abelmoschus manihot), a member of the Malvaceae family, is an edible medicinal plant known as Geumhwagyu in Korea (Geum et al., 2021). Hibiscus manihot has been reported to exhibits various pharmacological activities, including antioxidant, anti-obesity, anticancer, and immunomodulatory activities (Geum et al., 2021; Luan et al., 2020). In addition, we previously reported that Hibiscus manihot leaves inhibit excessive lipid accumulation by suppressing adipogenesis in 3T3-L1 cells (Geum et al., 2021). Hibiscus manihot contains various functional components such as flavonoids, amino acids, nucleosides, polysaccharides, organic acids, sterols, and volatile oils (Luan et al., 2020). In a previous study, we reported the presence of hyperoside, gossypin, tiliroside, and quercetin in Hibiscus manihot leaves (Geum et al., 2021). However, no other mechanisms of action related to the inhibition of lipid accumulation by Hibiscus manihot leaves in adipocytes were studied. Therefore, in the present study, we evaluated the effects of Hibiscus manihot leaves on lipolysis, browning, and autophagy in mouse adipocytes and 3T3-L1 cells.
Materials and Methods
Chemical reagents
Dexamethasone (DEX), 3-isobutyl-1-methylxanthine (IBMX) and insulin (INS), and Oil Red O staining solution were purchased from Sigma Aldrich (St. Louis, MO, USA). Primary antibodies against ATGL (#2138), p-HSL (#4137), HSL (#4107), Perilipin-1 (#9349), p-AMPK (#2535), AMPK (#5831), UCP-1 (#14670), LC3 (#2775), SQSTM/p62 (#39749), β-catenin (#9562), Cyclin D1 (#2922) and β-actin (#5125), and secondary antibody against anti-rabbit IgG, HRP-linked antibody (#7074) were purchased from Cell Signaling (Beverly, MA, USA). Primary antibodies against PGC-1α (sc-518025) and PRDM16 (ab106410) were purchased from Santa Cruz Biotechnology (Dallas, TX, USA) and Abcam (Cambridge, United Kingdom), respectively.
HML preparation
Water extracts of Hibiscus manihot leaves were prepared as described previously (Geum et al., 2021). Hibiscus manihot leaves grown in Korea (voucher number: ANU-2021-001) were provided by the Agricultural Corporation E-Farm Corp., Andong, Korea, after botanical identification by the Forest Medicinal Resources Research Center, National Institute of Forest Science, Yongju, Korea. In brief, 250 g of Hibiscus manihot leaves soaked in 5 L distilled water were left at 40℃ for 12 h. Next, the extracted liquid recovered through centrifugation at 12,000 rpm for 10 min at 4℃ was freeze-dried and powdered. The freeze-dried Hibiscus manihot leaves extract (HML) was dissolved in distilled water and used for experiments.
Cell culture
As the 3T3-L1 cell line is widely used to investigate adipocyte differentiation, we used this cell line in our study. The 3T3- L1 cells (American Type Culture Collection, Manassas, VA, USA) were maintained in DMEM/F-12 (Hyclone Laboratories Inc., UT, USA) containing 10% bovine calf serum (Gibco, NY, USA), 100 U/mL penicillin (Sigma Aldrich), 100 ㎍/mL streptomycin (Sigma Aldrich) at 37℃ under a humidified atmosphere of 5% CO2.
Differentiation of 3T3-L1 cells
Differentiation of 3T3-L1 cells was performed as previously described (Choi et al., 2023). Two days after the cells reached 100% confluence (designated as D0), the cells were cultured in DMEM/F-12 containing 10% fetal bovine serum (Gibco, NY, USA), 1 μM DEX, 0.5 mM IBMX, and 10 ㎍/mL INS (DMI media) for 2 days (designated as D2). After washing the cells thrice with 1 ×PBS, the cells were cultured in DMEM/F-12 containing 10% FBS and 10 ㎍/ mL INS for 2 days (designated as D4). Next, the cells were cultured by replacing the DMEM/F-12 containing 10% FBS once every 2 days (designated as D6 and D8). Cells were treated with HML from days D2 to D8, and the cells were harvested and analyzed on day D8.
Oil Red O staining
Oil Red O staining was performed as described previously (Choi et al., 2023). Cells washed with 1 ×PBS were fixed in 10% formalin for 1 h. Next, the cells were dehydrated in 60% isopropanol for 5 min. The cells were then left at room temperature to dry completely and stained with Oil Red O solution (in 60% isopropanol and 40% water) for 10 min. After washing the cells with distilled water, the stained lipids of the cells were photographed using a light microscope (Olympus, Tokyo, Japan), Next, the stained lipids were eluted using 100% isopropanol for quantitative analysis. Absorbance of the eluted solution was measured at 500 ㎚ using a microplate reader (SpectraMax M2; Molecular Devices, CA, USA).
Western blot analysis
The proteins extracted from the cells using RIPA buffer (Boston BioProducts, MA, USA) containing 0.1% protease inhibitor (Sigma Aldrich) and 0.1% phosphatase inhibitor (Sigma Aldrich) were quantified using the BCA protein assay (Thermo Fisher Scientific, Waltham, MA USA). The extracted proteins were separated using SDS-PAGE, and the separated proteins were transferred onto a nitrocellulose membrane (Thermo Fisher Scientific, Inc., Mam, USA). Later, the membrane was incubated with 5% nonfat milk in Tris-buffered saline containing 0.05% Tween 20 (TBS-T) at room temperature for 1 h and subsequently treated overnight with primary antibodies (1:1,000) in 5% BSA in TBS-T at 4℃. The membrane was then incubated with secondary antibodies (1:1,000) in 5% nonfat milk in TBS-T at room temperature for 1 h. After treatment with ECL Prime Western Blotting Detection Reagents (Amersham Biosciences Corp., Amersham, UK), the membrane was washed three times with TBS-T, and protein bands were visualized using a LI-COR C-DiGit Blot Scanner (LI-COR Biosciences, NE, USA). Quantitative analysis of the visualized protein bands was performed using UN-SCAN-IT gel software version 5.1 (Silk Scientific, Inc. UT, USA).
Cell proliferation assay for measuring the growth of 3T3-L1 cells
Cell proliferation assay was performed as described previously (Choi et al., 2023). The growth and cell cycle of the cells were measured using NucleoCounter NC-250TM Automated Cell Analyzer (Chemometec, Allerod, Denmark) according to the manufacturer’s protocol.
Measurement of free glycerol
Free glycerol content was measured as previously described (Choi et al., 2023). Free glycerol was analyzed using a Glycerol Cell-Based Assay Kit (Cayman Chemical, Ann Arbor, MI, USA), according to the manufacturer’s instructions. Briefly, on D8 after differentiation of 3T3-L1 cells, 25 μL of cell culture supernatants and 100 μL of reconstituted free glycerol assay reagent were mixed and incubated for 15 min at room temperature. Next, absorbance of the eluted solution was measured at 540 ㎚ using a microplate reader (SpectraMax M2; Molecular Devices, CA, USA).
Statistical analysis
All data are shown as mean ± SD (standard deviation). Statistical significance was determined using the Student’s t-test. *P <0.05 and #P <0.05 were considered statistically significant.
Results and Discussion
Effect of HML on regulation of lipolysis-related proteins in 3T3-L1 cells
Lipolysis, the process of triglyceride breakdown, is considered one of the potential targets for treatment of obesity (Duncan et al., 2007). It has been continuously demonstrated that adipose triglyceride lipase (ATGL), hormone-sensitive lipase (HSL), perilipin-1, and AMP-activated protein kinase (AMPK) are involved in lipolysis (Kim et al., 2016). ATGL converts triglycerides into diacylglycerols by removing free fatty acids (Gaidhu et al., 2010). Another important lipase that catalyzes lipolysis is HSL, which is associated with hormone regulation by insulin. HSL catalyzes hydrolysis of triglycerides to diacylglycerol and monoacylglycerol by continuously removing free fatty acids from triglycerides (Holm, 2003). Perilipin-1 inhibits lipolysis by blocking lipolytic enzymes from accessing lipid droplets. Thus, the decrease in perilipin-1 expression promotes access of lipolytic enzymes to lipid droplets, thereby increasing lipolysis (Frühbeck et al., 2014; Arner and Langin, 2014). In addition, it is known that AMPK is essential for the activation of the lipolytic process in adipocytes and promotes lipolysis by phosphorylating HSL in adipocytes (Smith et al., 2007; Yin et al., 2003). Thus, activation of ATGL, HSL, and AMPK and reduction of perilipin-1 are reported to be essential factors for lipolysis in adipocytes (Zhang et al., 2018).
In our study, HML significantly accumulated lipid droplets in 3T3-L1 cells (Fig. 1A). In addition, the expression of ATGL and HSL, and phosphorylation levels of HSL and AMPK were increased by HML treatment (Fig. 1B). Additionally, perilipin-1 expression was downregulated following HSL treatment (Fig. 1B). Free glycerol levels were measured to assess whether the regulation of lipolysis-related factors by HSL induces lipolysis; the contents of free glycerol were significantly increased by HML treatment (Fig. 1C). Our results (Fig. 1) suggested that HML blocked the accumulation of lipid droplets by inducing lipolysis in 3T3-L1 cells.
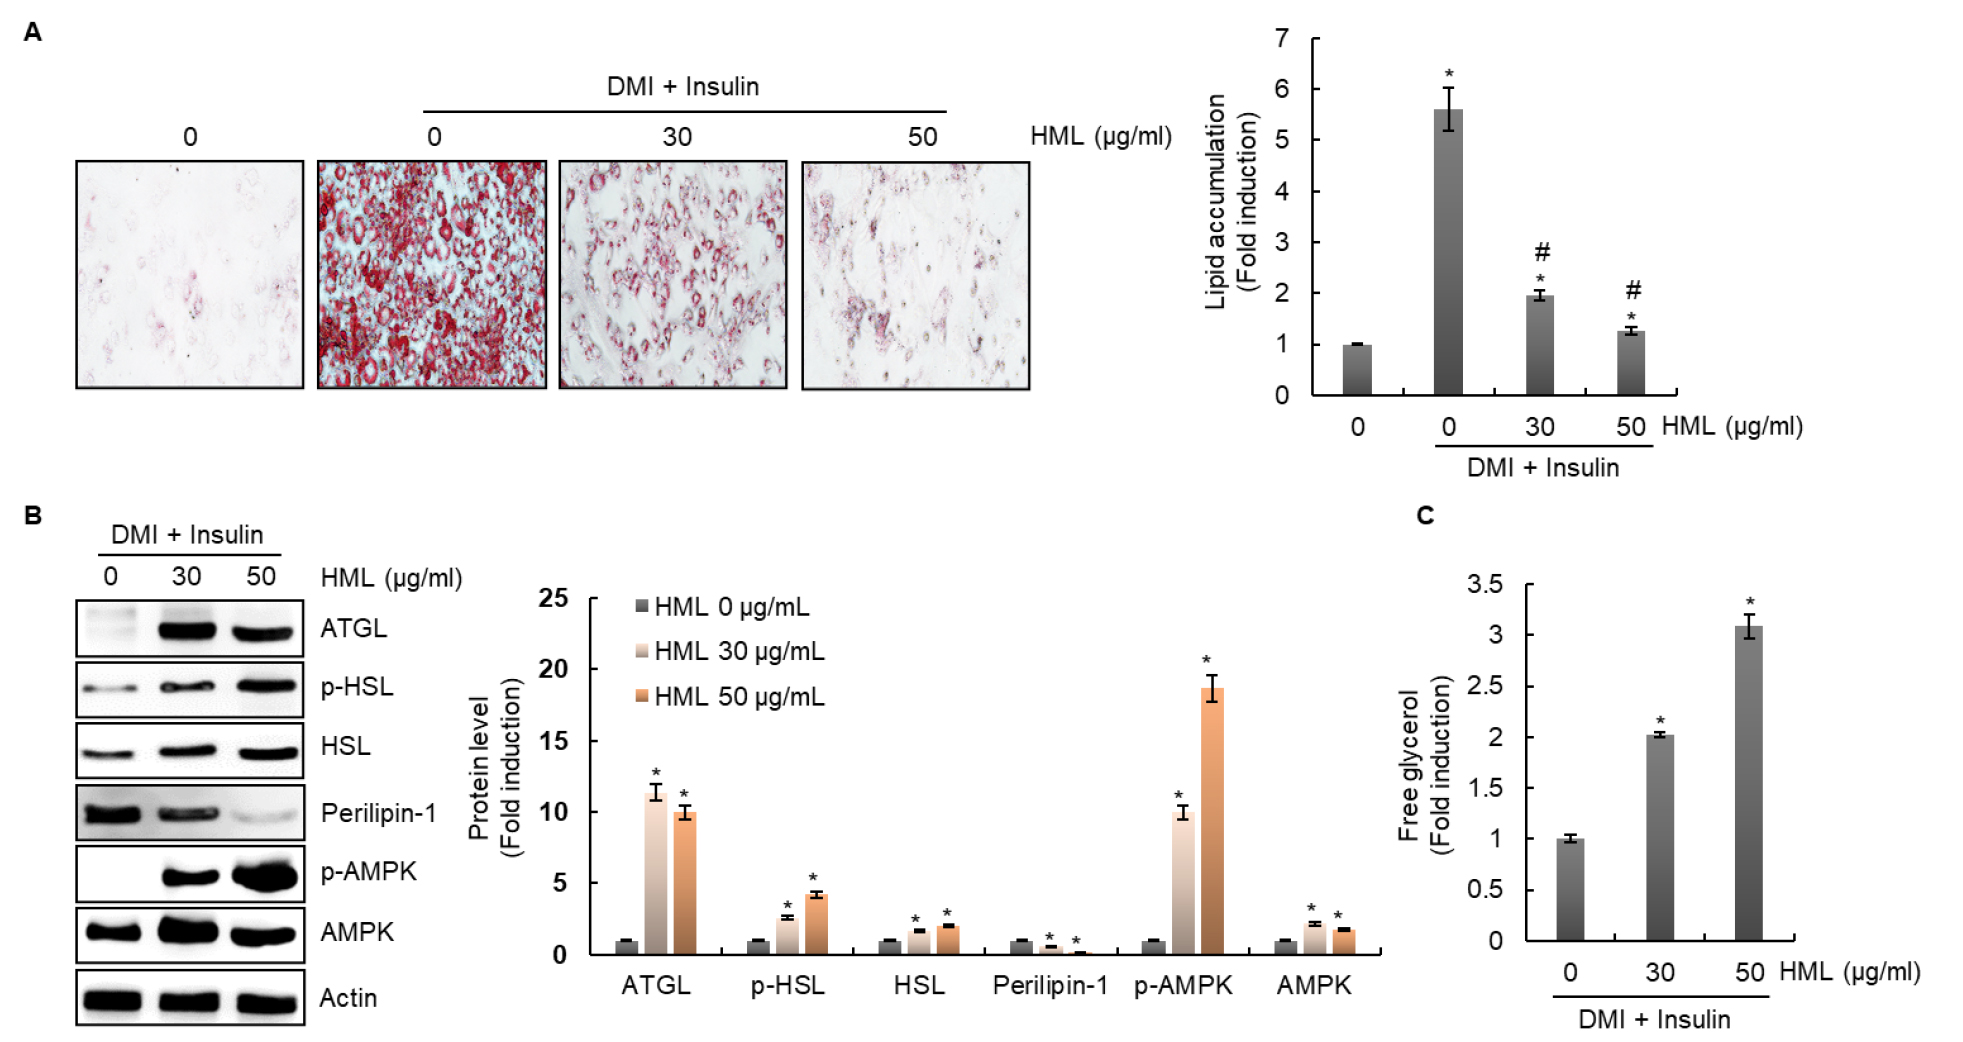
Fig. 1.
Effect of HML on the regulation of lipolysis-related protein level in 3T3-L1 cells. The cells were treated with HML from day 2 to day 8 in presence of DMI and insulin. (A) Accumulated lipid was measured by Oil Red O staining. *P < 0.05 compared to the cells without the treatment. #P < 0.05 compared to the without HML treatment in presence of DMI and insulin. (B) Protein levels were measured by Western blot analysis. *P < 0.05 compared to the treatment of DMI and insulin alone. (C) Free glycerol was analyzed using a cell-based glycerol assay kit. *P < 0.05 compared to the treatment of DMI and insulin alone.
Effect of HML on regulation of browning-related proteins in 3T3-L1 cells
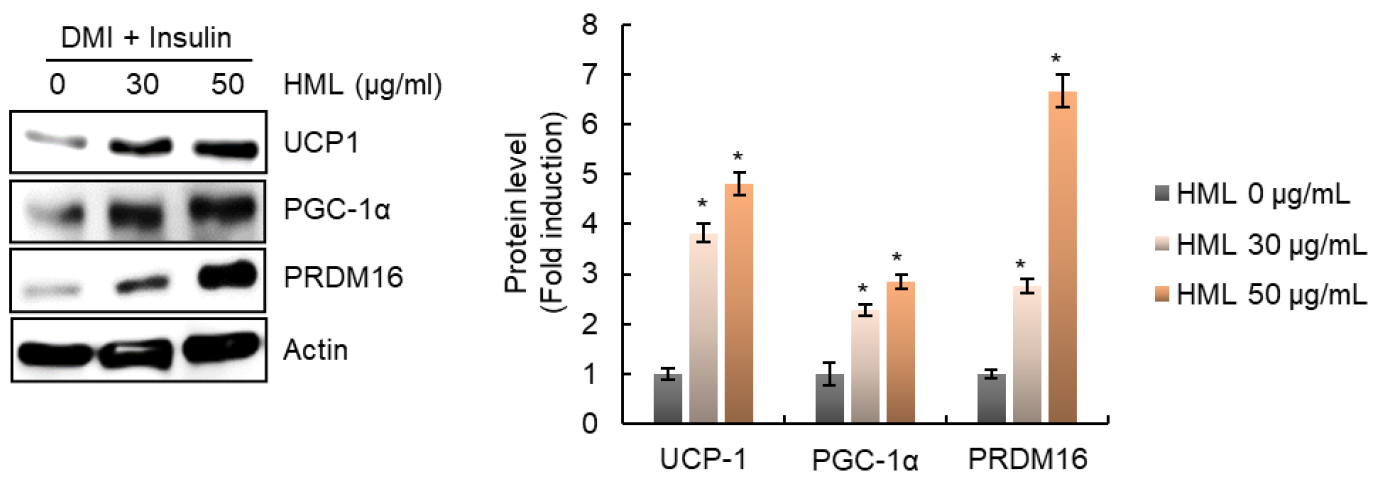
It is known that adipose tissue includes white adipose tissue (WAT), brown adipose tissue (BAT), and brown-like (beige) adipose tissue (Rosen and Spiegelman, 2014). WAT stores excess energy in the form of triglycerides, whereas BAT plays a role in dissipating excessive energy as heat (Cannon and Nedergaard, 2004). Therefore, the browning of WAT is considered to be an important target for preventing and treating obesity and obesity-related diseases (Dong et al., 2017). Thus, we analyzed the effect of HML on the regulation of levels of proteins such as uncoupling protein-1 (UCP-1), peroxisome proliferator-activated receptor-gamma coactivator-1α (PGC-1α), and PR domain containing 16 (PRDM16) to evaluate the effect of HML on WAT browning.
In brown adipocytes, UCP-1 dissipates energy as heat by uncoupling fatty acid oxidation via ATP synthesis. Thus, increase in UCP-1 expression can prevent obesity by increasing the dissipation of energy stored in free fatty acids (Jin et al., 2020). In addition, PGC-1α is known to be a nuclear transcription factor that induces the expression of UCP-1 (Trayhurn and Alomar, 2015). Furthermore, it was reported that PRDM16 is involved in WAT browning through direct activation of PGC-1α and UCP-1 and that the knockdown of PRDM16 in an animal model caused enlargement of the adipose tissue (Cohen et al., 2014). In the present study, we observed that HML dramatically increased the expression of UCP-1, PGC-1α, and PRDM16 (Fig. 2). These results suggest that HML induces WAT browning, which may be associated with the blocking of lipid droplet accumulation in 3T3-L1 cells.
Effect of HML on regulation of autophagy-related protein in 3T3-L1 cells
It is known that autophagy maintains cellular homeostasis by eliminating and recycling damaged cytoplasmic organelles, and abnormal proteins play an important role in adipogenesis (Glick et al., 2010). Therefore, autophagy is considered to be a potential anti-obesity target (Jansen et al., 2012). Inhibition of autophagy suppresses adipogenesis in adipocytes and mice (Baerga et al., 2009). However, it has also been reported that, on the contrary, autophagy is downregulated in adipose tissue derived from high-fat diet–fed mice and hypertrophic adipocytes, and that continuous activation of autophagy suppresses adipogenesis through lipolysis (Yoshizaki et al., 2012). In addition, it has been reported that activation of autophagy decreases lipid accumulation in hepatocytes (Vasarri et al., 2021).
Therefore, we analyzed the conversion of microtubule-associated protein 1A/1B-light chain 3 (LC3)-1 to LC3-II and sequestosome 1 (SQSTM1)/p62 levels by western blotting to investigate whether HML activates or inhibits autophagy in adipocytes. HML increased LC3-I and LC3-II protein levels and decreased SQSTM1/p62 protein levels (Fig. 3), thereby indicating that HML activated autophagy in 3T3-L1 cells. These results suggest that activation of autophagy by HML may be involved in suppressing the accumulation of lipid droplets in 3T3-L1 cells.

Effect of HML on proliferation of 3T3-L1 cells
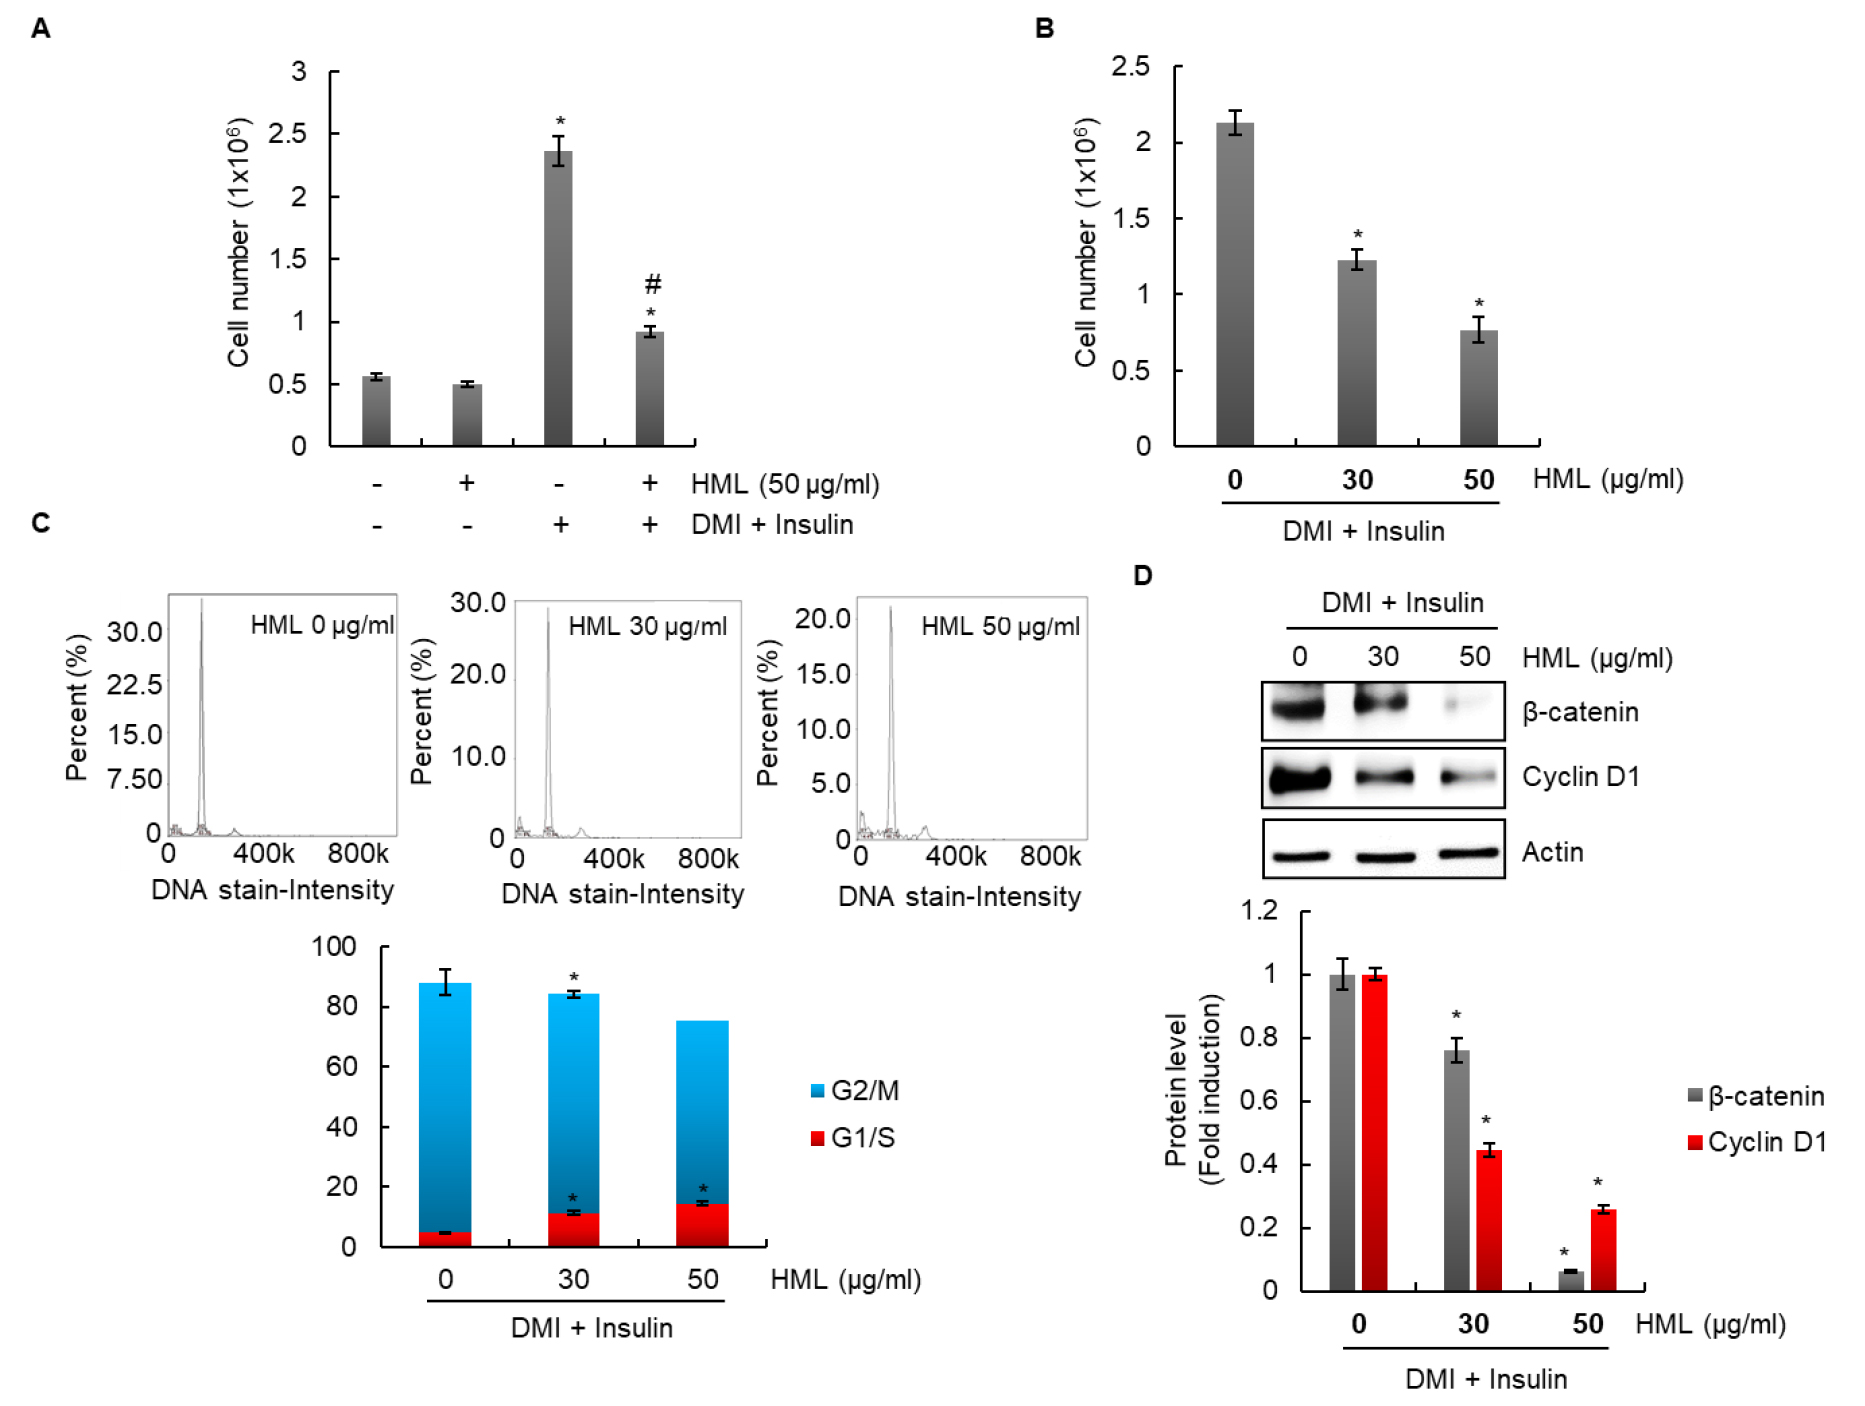
As shown in Fig. 4A, HML did not affect the growth of 3T3-L1 cells in the absence of DMI or insulin; however, the growth of differentiated 3T3-L1 cells in the presence of DMI and insulin was suppressed by HML. HML dose-dependently inhibited the growth of 3T3-L1 cells that were differentiated using DMI and insulin (Fig. 4B). To investigate whether cell cycle arrest results in HML-mediated inhibition of the growth of 3T3-L1 cells, these cells were treated with HML; the G1/S phase was observed to be significantly increased by HML treatment (Fig. 4C). In addition, HML suppressed the expression of β-catenin and cyclin D1, which are proteins associated with cell cycle progression. These results indicate that HML may inhibit excessive proliferation of adipocytes that differentiate into mature adipocytes by arresting the cell cycle.
Differentiation of preadipocytes into mature adipocytes and proliferation of mature adipocytes are known to induce WAT expansion (Wagner et al., 2017). Therefore, inhibiting the growth of mature adipocytes is a potential therapeutic approach for prevention and treatment of obesity. Taken together, these results suggest that inhibition of the proliferation of mature adipocytes by HML may contribute to the blocking of lipid droplet accumulation in 3T3-L1 cells.
In the present study, HML upregulated the levels ATGL, p-HSL, HSL, and p-AMPK, which are proteins associated with lipolysis, and downregulated perilipin-1, a protein associated with lipolysis. HML upregulated UCP1, PGC-1α, and PRDM16 associated with adipocyte browning. In addition, HML upregulated LC3-I and LC3-II, and downregulated SQSTM/p62, which are proteins associated with autophagy. Lastly, HML blocked excessive growth of 3T3-L1 cells by suppressing the cell cycle through the inhibition of β-catenin and cyclin D1 expression. These results indicate that HML induces lipolysis and adipocyte browning, activates adipocyte autophagy, and inhibits the proliferation of mature adipocytes. These activities of HML may contribute to excessive lipid accumulation in adipocytes. We believe that HML can be developed as an anti-obesity agent in the future.