

Introduction
Materials and Methods
Grain collection and cultivation
Recording of agronomical traits
Statistical analysis
Results and Discussion
Variation of agro-morphological traits in the total population
Variation of agro-morphological traits between wild and cultivated genotypes
Continental variation of agro-morphological traits
Interaction of barley type and continent
HCA, PCA, and Pearson’s correlation analysis
Introduction
Barley (Hordeum vulgare L.) ranks among the top four cereal crops globally in terms of production. According to FAO (2023), global barley production has reached approximately 146 million tonnes, cultivated on over 46 million hectares. Russia is currently the leading barley-producing country, followed by Australia, France, Germany, and Canada. In Korea, barley production increased from around 25,000 tonnes in 2019 to about 66,000 tonnes in 2023 (FAO, 2023).
Barley is cultivated across diverse agro-ecological zones for food, animal feed, and malting (Dickin et al., 2012; Khera et al., 2025; von Korff et al., 2008). Its grains are rich in nutrients and secondary metabolites, including flavonoids, lignans, proanthocyanidins, and phenolic acids (Idehen et al., 2017; Shawky et al., 2024). These compounds contribute to the health-promoting and disease-preventive properties of barley, such as antidiabetic, anticancer, anti-inflammatory, and antioxidant effects (Idehen et al., 2017; Shawky et al., 2024). Given the challenges posed by climate change and population growth, barley represents a promising source of nutrition and a sustainable food option. Because of these, several studies have focused on enhancing the nutritional and biochemical qualities of barley genotypes alongside their agronomic performance (Hebbache et al., 2024; Kaur et al., 2022; Khera et al., 2025; Martínez et al., 2018; Shawky et al., 2024).
The agronomic and biochemical traits of barley are strongly influenced by both genetic and environmental factors (Hosseini et al., 2019; Sallam et al., 2018). Its genetic diversity has been shaped over centuries through natural and artificial selection, resulting in a wide range of landraces and cultivars. Among these, H. vulgare ssp. spontaneum (wild barley) and H. vulgare ssp. vulgare (cultivated barley) are predominant (Yu et al., 2022). Modern barley breeding programs, as in many other crops, focus on improving yield, grain quality, and stress tolerance while maintaining genetic diversity to avoid crop vulnerability (Meng et al., 2023). In this regard, wild barley, the progenitor of cultivated barley, offers an important gene pool for improving cultivated varieties. It contains valuable genetic traits that enhance both biotic and abiotic stress tolerance and maximize yield (Al-Hajaj et al., 2025; Asfaw et al., 1990). Owing to these qualities, wild barley genotypes have been used in the development of improved cultivars (Lakew et al., 2011; Rehman et al., 2021). Therefore, a systematic evaluation of agro-morphological traits across large collections of barley genotypes is necessary. This process supports the identification of promising accessions for breeding programs, ensuring long-term crop sustainability (Hebbache et al., 2024; Kaur et al., 2022).
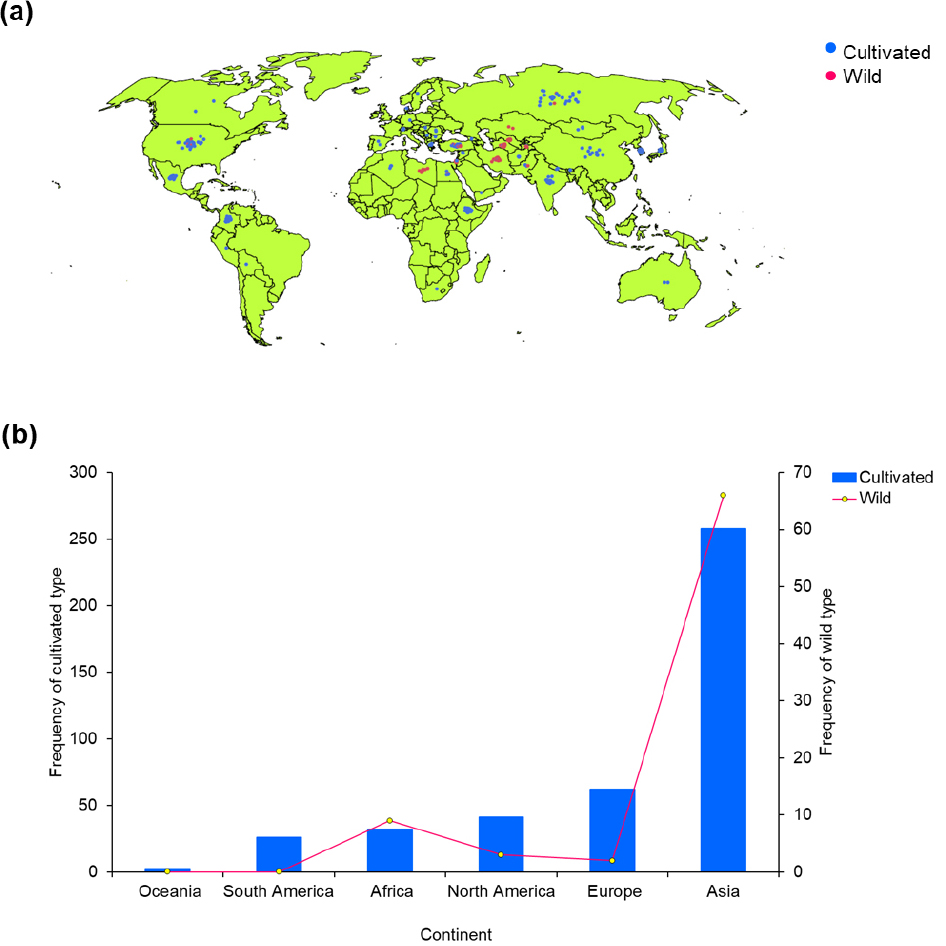
Gene banks around the world play a crucial role in conserving crop genetic resources, including barley which are vital for future crop improvement (Jiang et al., 2021; Kaur et al., 2022; Milner et al., 2019). In the Republic of Korea, interest is growing in developing new barley varieties with improved traits, including high yield, disease resistance, stress tolerance, and brewing quality (Lee et al., 2023; Park et al., 2022; Yoon et al., 2022). The gene bank at the National Agrobiodiversity Center (RDA, Jeonju, Republic of Korea) currently conserves over 36,000 barley accessions, including more than 31,000 cultivated types (H. vulgare ssp. vulgare) (Yu et al., 2025). Most of these accessions remained unstudied in terms of their agronomic performances and grain qualities. Considering barley’s importance in food, feed, and industry, exploring the genetic variations of these germplasms is crucial. This study aims to analyze the agro-morphological diversity of 423 cultivated and 78 wild barley germplasm collected from six continents. The findings of this study could provide valuable insights into genotype and origin-associated variations in agro-morphological traits of barley and support the identification of accessions for breeding programs.
Materials and Methods
Grain collection and cultivation
A total of 501 barley accessions, including 78 wild and 423 cultivated varieties, were accessed from the National Agrobiodiversity Center, Rural Development Administration (RDA Jeonju, Republic of Korea). The accessions were originally collected from six different continents (Fig. 1). Field cultivation was conducted during the 2022-2023 winter season on clay loam soil in an experimental farm found at the National Agrobiodiversity Center (RDA Jeonju, Republic of Korea). Briefly, for each genotype, fifty seeds were sown on 25 October 2022 in a 90 ㎝ long row with an accession-to- accession distance of 60 ㎝. The distance between rows was also kept at 60 ㎝. A completely decomposed manure was applied as fertilizer (1.5 tons/10a). The accessions were cultivated under uniform growth conditions and the cultivation period lasted until June 2023. The average temperature, humidity, and precipitation during the cultivation period were 15.20℃, 67.00%, and 51.10 ㎜ in October, 11.10℃, 63.00%, and 77.00 ㎜ in November, -0.20℃, 67.00%, and 30.00 ㎜ in December, 0.80℃, 64.00%, and 26.80 ㎜ in January, 3.00℃, 62.00%, and 9.60 ㎜ in February, 10.20℃, 51.00%, and 27.00 ㎜ in March, 14.20℃, 60.00%, and 45.00 ㎜ in April, 19.40℃, 65.00%, and 240.70 ㎜ in May, and 23.30℃, 70.00%, and 169.90 ㎜ in June, respectively.
Recording of agronomical traits
The agronomic qualities of the barley accessions were recorded based on the RDA guidebook prepared for the characterization and management of genetic resources (RDA, 2006). Fifteen agronomical traits, consisting of seven qualitative traits (growth habit, flag leaf attitude, spike attitude, cold weather damage, lodging rate, spike type, and grain type) and eight quantitative traits (days to heading (DH), days to maturity (DM), plant height (PH), culm length (CL), spike length (SL), awn length (AL), number of grains per spike (GPS), and one-thousand-grains weight (TGW)) were recorded from field observation and post-harvest investigation. Details regarding the recording parameters of each trait can be viewed in our recent study (Desta et al., 2024).
Statistical analysis
The Shannon-Weaver diversity index (H) was calculated to evaluate the diversity of categorical traits in the entire population using equation 1 (Shannon, 1948; Zanklan et al., 2018).
H was then standardized by converting it to a relative phenotypic diversity index (H’) after dividing it by as shown in equation 2 (Rabara et al., 2014; Shannon, 1948).
In the above equations, pi represents the frequency proportion of the ith descriptor state, and n is the total number of states observed within a trait. The distribution difference of categorical traits among barley varieties and between continents was assessed using the Chi-square test (Yirgu et al., 2022). The diversity of quantitative traits was evaluated based on the coefficient of variation (CV) and analysis of variance (ANOVA) using Duncan’s multiple range test at a significance level of p &5. All statistical analyses were conducted using xlstat software (Lumivero, CO, USA). Two- way hierarchical cluster analysis (HCA) and principal component analysis (PCA) were computed using JMP Pro-17 software (SAS, Inc., Cary, North Carolina, USA). Pearson’s correlation analysis was computed using the Metan package in R-software version 4.2 (www.r-project.org) and variables were allowed to aggregate based on their degree of correlation.
Results and Discussion
Variation of agro-morphological traits in the total population
Agro-morphological traits are essential for evaluating yield, stress tolerance, and disease resistance in crops (Liu et al., 2015; Nadolska-Orczyk et al., 2017; Park et al., 2022). In this study, diversity in categorical traits was assessed using H’, and quantitative traits were analyzed using statistical methods (Table 1, Table 2, Supplementary Table 1, Supplementary Table 2). Most qualitative traits exhibited high genetic diversity (H’ > 0.80), except for grain type and lodging rate (Lasa et al., 2001; Yirgu et al., 2022). Erect growth habit (57.88%) and horizontal flag leaf attitude (55.09%) were the most common. Spike attitude was more evenly distributed among the four categories. Intermediate cold resistance was the most frequent (44.91%), and most accessions (88.42%) were resistant to lodging. Likewise, six-row spikes (65.47%) and hulled grain types (88.42%) were dominant over two-row spikes and hulless grains. Generally, the observed variations were in agreement with several previous studies, and hence, could provide numerous options for selecting accessions with desirable qualities (Benlioglu et al., 2024; Lasa et al., 2001; Liu et al., 2015; Manju et al., 2023; Meng et al., 2023; Park et al., 2022; Spanic et al., 2025; Yadav et al., 2018).
Table 1.
Standardized Shannon-Weaver index and Chi-square values of qualitative agronomical traits across wild and cultivated type barley accessions of different origins.
| Parameter |
H'z (Total population) | Barley type | Barley origin (continent) | |||
| χ2y | p-value | χ2 | p-value | |||
| Growth habit | 0.83 | 128.29 | <0.0001 | 46.67 | <0.0001 | |
| Flag leaf attitude | 0.90 | 69.14 | <0.0001 | 16.41 | 0.0885 | |
| Cold weather damage | 0.92 | 66.78 | <0.0001 | 31.01 | 0.0454 | |
| Lodging rate | 0.32 | 23.32 | <0.0001 | 54.09 | <0.0001 | |
| Spike attitude | 0.98 | 30.55 | <0.0001 | 97.77 | <0.0001 | |
| Spike type | 0.93 | 166.98 | <0.0001 | 41.95 | <0.0001 | |
| Grain type | 0.52 | 12.46 | 0.0004 | 19.88 | 0.0013 | |
Table 2.
Variations of quantitative agronomical traits across wild and cultivated barley types of different origins.
| Parameter | Barley type | Value | Total population | Continent | ANOVAq | ||||||||||||
|
North America | Asia | Europe | Africa | Oceania |
South America |
Type (T) |
Continent (C) | T × C | |||||||||
| DHr (Days) | Cultivated | Mean | 181.83 | 179.56 | 180.87 | 189.05 | 182.13 | 186.00 | 177.08 | *** | *** | *** | |||||
| CV (%) | 4.14 | 4.33 | 3.56 | 4.43 | 3.75 | 0.00 | 2.59 | ||||||||||
| Wild | Mean | 178.01 | 175.00 | 178.55 | 179.00 | 175.00 | - | - | |||||||||
| CV (%) | 2.40 | 0.47 | 2.46 | 0.00 | 1.37 | - | - | ||||||||||
| DMs (Days) | Cultivated | Mean | 220.29 | 219.2 | 219.27 | 224.82 | 223.72 | 224.00 | 216.85 | *** | *** | *** | |||||
| CV (%) | 2.60 | 2.10 | 2.42 | 2.43 | 1.85 | 0.45 | 2.77 | ||||||||||
| Wild | Mean | 216.94 | 214.33 | 217.38 | 217.00 | 214.67 | - | - | |||||||||
| CV (%) | 2.11 | 0.88 | 2.16 | 0.00 | 1.81 | - | - | ||||||||||
| PHt (㎝) | Cultivated | Mean | 96.10 | 93.35 | 94.91 | 97.22 | 107.08 | 70.53 | 98.14 | *** | *** | ** | |||||
| CV (%) | 16.61 | 15.57 | 16.17 | 17.80 | 14.99 | 47.64 | 10.67 | ||||||||||
| Wild | Mean | 121.76 | 102.09 | 123.33 | 133.03 | 114.61 | - | - | |||||||||
| CV (%) | 9.38 | 8.46 | 8.35 | 3.03 | 9.69 | - | - | ||||||||||
| CLu (㎝) | Cultivated | Mean | 88.47 | 84.78 | 88.27 | 87.12 | 97.58 | 61.67 | 90.34 | *** | *** | *** | |||||
| CV (%) | 17.29 | 16.20 | 16.75 | 19.55 | 15.44 | 46.65 | 11.08 | ||||||||||
| Wild | Mean | 111.39 | 91.62 | 112.92 | 123.60 | 104.40 | - | - | |||||||||
| CV (%) | 9.97 | 9.83 | 8.80 | 3.59 | 9.85 | - | - | ||||||||||
| SLv (㎝) | Cultivated | Mean | 7.64 | 8.57 | 6.65 | 10.09 | 9.50 | 8.87 | 7.80 | *** | *** | *** | |||||
| CV (%) | 31.39 | 28.50 | 28.55 | 19.54 | 20.56 | 54.51 | 19.41 | ||||||||||
| Wild | Mean | 10.37 | 10.47 | 10.42 | 9.43 | 10.21 | - | - | |||||||||
| CV (%) | 11.65 | 7.68 | 12.07 | 4.24 | 9.29 | - | - | ||||||||||
| ALw (㎜) | Cultivated | Mean | 12.27 | 13.06 | 10.49 | 16.80 | 15.72 | 16.25 | 13.44 | *** | *** | *** | |||||
| CV (%) | 35.90 | 29.99 | 38.00 | 15.42 | 19.13 | 8.72 | 18.67 | ||||||||||
| Wild | Mean | 16.48 | 16.23 | 16.52 | 14.80 | 16.72 | - | - | |||||||||
| CV (%) | 12.03 | 11.46 | 12.39 | 1.80 | 9.28 | - | - | ||||||||||
| GPSx (n) | Cultivated | Mean | 50.61 | 43.43 | 55.02 | 40.42 | 45.79 | 25.60 | 50.05 | *** | *** | ** | |||||
| CV (%) | 33.01 | 40.79 | 26.89 | 46.10 | 34.75 | 10.94 | 21.53 | ||||||||||
| Wild | Mean | 22.07 | 18.60 | 22.39 | 24.90 | 20.31 | - | - | |||||||||
| CV (%) | 17.11 | 20.98 | 15.98 | 13.25 | 19.39 | - | - | ||||||||||
| TGWy (g) | Cultivated | Mean | 41.81 | 44.11 | 38.58 | 48.04 | 50.10 | 48.50 | 44.83 | *** | *** | *** | |||||
| CV (%) | 17.71 | 15.72 | 16.07 | 8.27 | 14.46 | 6.53 | 11.45 | ||||||||||
| Wild | Mean | 48.40 | 52.78 | 48.15 | 39.67 | 50.67 | - | - | |||||||||
| CVz (%) | 14.76 | 4.32 | 15.28 | 0.84 | 10.19 | - | - | ||||||||||
Quantitative traits also showed broad variation, with PH, CL, SL, AL, and DH displaying near symmetrical distributions (Table 2, Fig. 2). Conversely, GPS and TGW were right-skewed, while DM was slightly left-skewed. Except for DH and DM, all traits had CVs above 17.00%, indicating high variability (Table 2). Trait ranges, including DH (163.00- 209.00 days), DM (204.00-240.00 days), PH (36.93-152.13 ㎝), CL (32.90-140.70㎝), SL (1.97-15.30㎝), AL (2.73-23.03 ㎜), GPS (12.60-81.20), and TGW (14.00-70.67 g), were wide and consistent with previous studies in Korea, Turkey, and India, among others (Czembor and Czembor, 2022; Dziurdziak et al., 2021; Güngör et al., 2024; Iannucci et al., 2021; Khera et al., 2025; Kim et al., 2022). Based on these results, a set of tiered criteria was established, supported by the performances of control cultivars, to identify accessions with high performance and desirable agronomic traits suitable for Korean field conditions (Park et al., 2008; 2011). The first stage of selection involved common traits, including growth habit, maturity, CWD, and lodging rate. Maturity was assessed by harvest time, favoring accessions maturing in late May or early June to avoid terminal stress and ensure yield stability. Additionally, accessions exhibiting resistance or semi-resistance to cold weather damage, absence of lodging, and erect or semi-erect growth habit were prioritized. Subsequent selection was based on spike type and grain characteristics. For two-row spikes and hulled grains, accessions with SL of 8-10 ㎝, CL of 70-90 ㎝, and GPS above 23 were selected. For both six-row spikes with hulless and hulled grains, the criteria included SL of 4-6 ㎝ and GPS above 50, with CL ranging from 70-90 ㎝ for hulless types and below 100 ㎝ for hulled types. Accordingly, 19 promising accessions were identified (Table 3). Two wild types (K217555 and K163361) were included among the selected accessions, despite exhibiting undesirable CL. Overall, these best-performing accessions may be valuable for future breeding programs (Jan et al., 2022; Rehman et al., 2021).
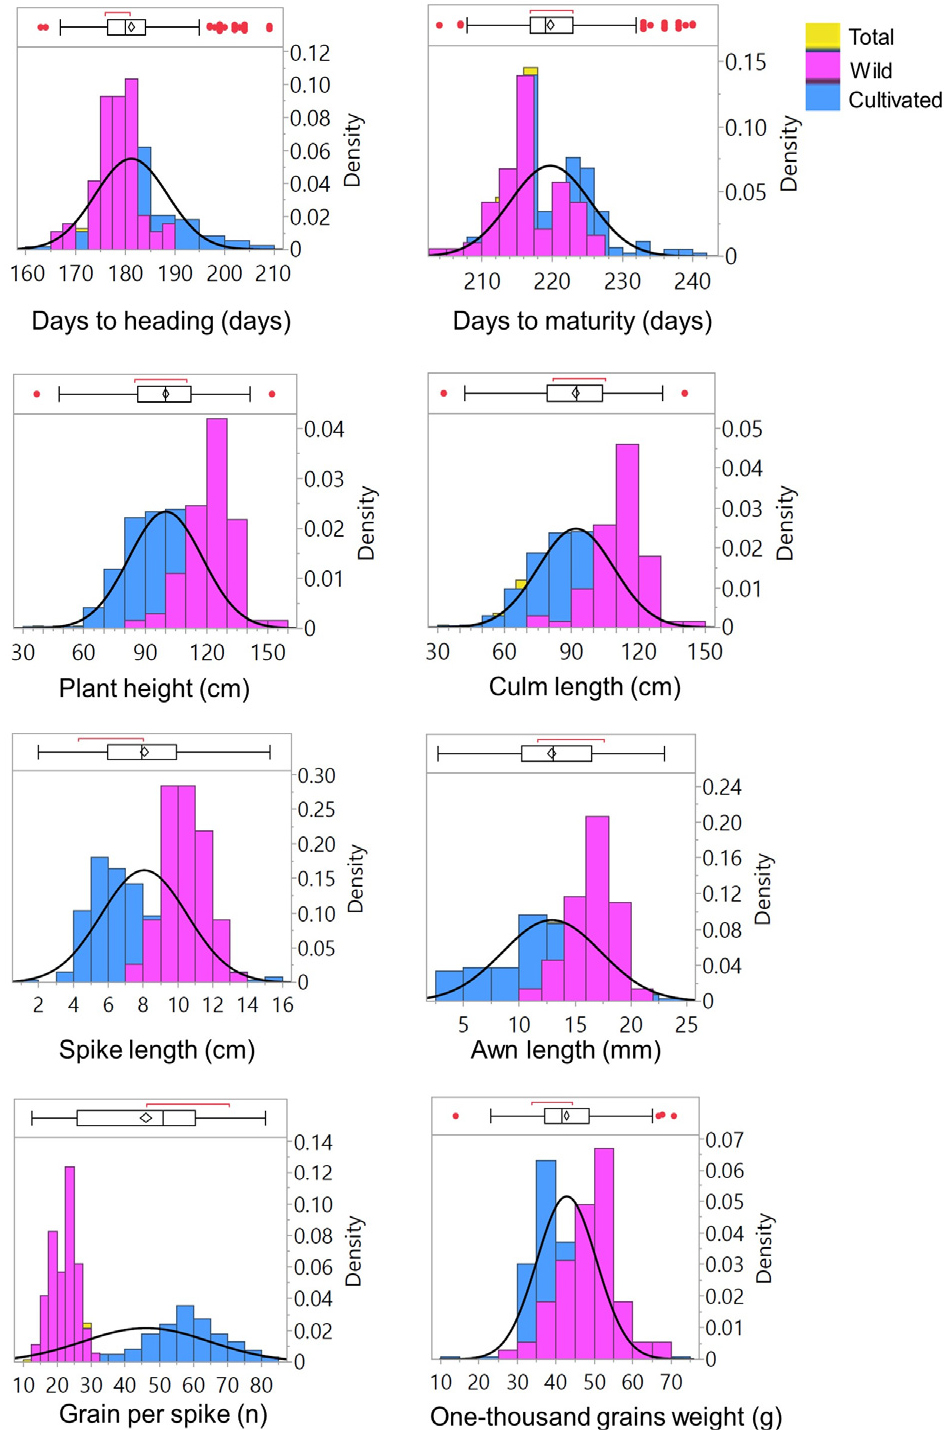
Fig. 2.
Distribution of quantitative traits across the total population, wild genotypes, and cultivated genotypes. In the boxplots, upper and lower edges represent the 75th percentile and 25th percentile, respectively in the total population, whiskers extend 1.5 × the interquartile ranges, central horizontal lines represent median values, and values outside whiskers indicate outliers.
Table 3.
List of promising barley genotypes identified based on tiered selection criteria and their key characteristics.
| Type | Accession | Origin | Maturity | GHz | CWDy | STx | LRw | GHv | CL (㎝)u | SL (㎝)t | GPS (n)s |
| Cultivated | IT-017263 | North America | Late May | Semi-erect | Semi-resistant | Six-rows | Nothing | Hulled | 84.87 | 5.10 | 32.60 |
| Cultivated | IT-017419 | Asia | Early June | Semi-erect | Semi-resistant | Six-rows | Nothing | Hulled | 82.00 | 5.20 | 76.20 |
| Cultivated | IT-106478 | Asia | Late May | Semi-erect | No damage | Six-rows | Nothing | Hulled | 98.20 | 4.63 | 71.60 |
| Cultivated | IT-107560 | Asia | Early June | Semi-erect | Semi-resistant | Six-rows | Nothing | Hulled | 90.43 | 5.30 | 64.40 |
| Cultivated | IT-108233 | Asia | Early June | Semi-erect | Semi-resistant | Six-rows | Nothing | Hulled | 94.00 | 5.27 | 57.60 |
| Cultivated | IT-108485 | Asia | Late May | Semi-erect | No damage | Six-rows | Nothing | Hulled | 82.70 | 4.83 | 73.40 |
| Cultivated | K128343 | North America | Late May | Semi-erect | Semi-resistant | Six-rows | Nothing | Hulled | 76.70 | 9.13 | 68.40 |
| Cultivated | K128344 | North America | Late May | Semi-erect | Semi-resistant | Six-rows | Nothing | Hulled | 76.50 | 9.30 | 57.60 |
| Cultivated | K276025 | Asia | Late May | Semi-erect | Semi-resistant | Six-rows | Nothing | Hulled | 88.10 | 6.00 | 50.00 |
| Cultivated | IT-017493 | Asia | Early June | Semi-erect | Semi-resistant | Six-rows | Nothing | Hulless | 58.90 | 4.57 | 54.40 |
| Cultivated | IT-107885 | Asia | Late May | Semi-erect | Semi-resistant | Six-rows | Nothing | Hulless | 99.27 | 5.67 | 61.20 |
| Cultivated | IT-107980 | Asia | Early June | Semi-erect | Semi-resistant | Six-rows | Nothing | Hulless | 90.07 | 4.03 | 66.60 |
| Cultivated | IT-108006 | Asia | Early June | Semi-erect | Semi-resistant | Six-rows | Nothing | Hulless | 96.83 | 5.30 | 75.40 |
| Cultivated | IT-164459 | Asia | Late May | Semi-erect | Semi-resistant | Two-rows | Nothing | Hulled | 94.43 | 8.97 | 27.60 |
| Cultivated | IT-246493 | Europe | Early June | Semi-erect | Semi-resistant | Two-rows | Nothing | Hulled | 59.80 | 9.47 | 28.00 |
| Cultivated | IT-246498 | Europe | Early June | Semi-erect | Semi-resistant | Two-rows | Nothing | Hulled | 73.57 | 9.67 | 27.60 |
| Cultivated | K222753 | Europe | Early June | Semi-erect | Semi-resistant | Two-rows | Nothing | Hulled | 90.90 | 9.07 | 29.80 |
| Wild | K217555 | Asia | Late May | Intermediate | No damage | Two-rows | Nothing | Hulled | 120.20 | 12.10 | 22.80 |
| Wild | K163361 | Asia | Early June | Intermediate | No damage | Two-rows | Nothing | Hulled | 115.23 | 8.47 | 27.20 |
| Control | Hopum | Korea | Early May | Semi-erect | Intermediate | Two-rows | Nothing | Hulled | 76.33 | 6.23 | 23.20 |
| Control | Olbori | Korea | Late May | Semi-erect | Intermediate | Six-rows | Nothing | Hulled | 84.70 | 5.07 | 48.20 |
| Control | Saessal | Korea | Early June | Semi-erect | Intermediate | Six-rows | Nothing | Hulless | 82.00 | 6.47 | 61.20 |
| Control | Betawon | Korea | Mid June | Intermediate | Severe | Six-rows | Nothing | Hulless | 53.10 | 5.80 | 61.60 |
Variation of agro-morphological traits between wild and cultivated genotypes
The agronomic performances of crops are affected by environmental and genetic factors. Understanding the effects of these factors can support the development of improved varieties (Güngör et al., 2024; Sallam et al., 2018; Shakhatreh et al., 2010). Chi-square analysis revealed significant variations between wild and cultivated barley types for all qualitative traits (p &001) except for grain type (Table 1). Grain type showed significant variation at p = 0.0004 level. Cultivated types were mainly semi-erect in growth habit (66.19%), horizontal in flag leaf attitude (47.28%), and semi-erect in spike attitude (26.71%). Moreover, they were mostly susceptible to cold damage (27.90% susceptible; 14.42% severe) but showed strong resistance to lodging (90.78% no lodging). They were predominantly six-rowed in spike type (77.54%) and mostly hulled in grain type (86.29%), with small proportions of two-row spikes (22.46%) and hulless grains (13.71%). In contrast, wild types were mainly intermediate in growth habit (87.18%) and horizontal in flag leaf attitude (97.544%), with a mix of erect (34.60%), semi-erect (30.77%), and horizontal (26.92%) spike attitudes. They were more resistant to cold (50.00% intermediate-resistant; 46.15% semi-resistant) and moderately resistant to lodging (75.64% no lodging). Wild types were also exclusively two-rowed in spike type and entirely hulled in grain type. Supporting our findings, previous studies have also reported wide variability in qualitative traits among different barley genotypes (Akdogan et al., 2025; Benlioglu et al., 2024; Gadissa et al., 2021; Habtegebriel et al., 2024; Kaur et al., 2022; Yadav et al., 2018).
Different distributional trends were also observed for most quantitative traits. DH, DM, and GPS were right-skewed, while PH, CL, SL, AL and TGW were left-skewed in cultivated types. In contrast, wild types showed opposite patterns for these traits (Fig. 2). On average, cultivated types were later in heading (181.83 days) and maturity (220.29 days) compared to wild types (178.01 and 216.94 days, respectively) (Table 2). They were also shorter in height (96.10 ㎝) and culms (88.39 ㎝), with shorter spikes (7.64 ㎝) and awns (12.27 ㎜). In terms of yield components, cultivated types produced more GPS (50.61) but lighter grains (TGW: 41.81 g), whereas wild types had fewer GPS (22.07) but heavier grains (TGW: 48.40 g). Most of these values were comparable with previous reports on specific barley types (Kaur et al., 2022; Lakew et al., 2011; Rehman et al., 2021; Shakhatreh et al., 2010). The observed variations, in general, signify the potential for selecting wild genotypes to improve maturity and stress tolerance, as well as cultivated types to increase yield through targeted breeding programs (Capasso et al., 2021; Lakew et al., 2011).
Continental variation of agro-morphological traits
Despite the lack of statistical analysis, several studies have reported diversity in agronomic traits among barley genotypes from different regions (Czembor and Czembor, 2022; Dziurdziak et al., 2021; Güngör et al., 2024; Kaur et al., 2022; Milner et al., 2019). Chi-square analysis once again showed significant variations of all qualitative traits, except for flag leaf attitude, at different levels of significance (Table 1, Supplementary Table 1). Asian accessions were predominantly semi-erect in growth habit (59.88%), two-row in spike type (71.30%), and intermediate in cold resistance (59.09%). In contrast, European accessions were mainly intermediate in growth habit (51.56%), drooping in spike attitude (43.75%), and intermediate in cold resistance (43.75%). Unlike Europe and Asia, African accessions showed a more balanced spike attitude, with drooping (34.15%) and semi-drooping (26.83%) types, but were more susceptible to cold (41.46%). Across all regions, horizontal flag leaf orientation and hulled grain type were dominant. These results suggest that trait variation in barley is strongly affected by geographic origin and hence, could be used as a criterion to discriminate a large collection of genetic materials (Benlioglu et al., 2024; Dziurdziak et al., 2021; Güngör et al., 2024; Kaur et al., 2022; Milner et al., 2019).
In terms of quantitative traits, European accessions took the longest days to head (DH: 188.73 days) and mature (DM: 224.58 days). They also had the longest spikes (10.07 ㎝) and awns (16.74 ㎜). In contrast, South American accessions matured the earliest, with DH of 177.08 days and DM of 216.85 days (Table 2, Supplementary Table 2). They also produced the most grains in a spike (GPS = 50.05). Asian accessions had the shortest spikes (7.39 ㎝) and awns (11.68 ㎜), but they produced the lightest grains (TGW = 40.47 g). African accessions, on the other hand, were the tallest (PH = 108.73 ㎝) and had the longest culms (CL = 99.07 ㎝) and the heaviest grains (TGW = 50.123 g). Oceania accessions exhibited the shortest PH (70.53 ㎝) and CL (61.67 ㎝), as well as the lowest GPS (25.60). These observations could reflect genetic variances and differences in environmental adaptation among barley genotypes of different origins (Al-Hajaj et al., 2025; Lakew et al., 2011; Rehman et al., 2021).
Interaction of barley type and continent
The interaction effect of barley type and continent (T × C) revealed significant variations across all traits at different levels of significance (Table 2). On average, wild types from North America and Africa both had the shortest DH (175.00 days), with the former also exhibiting the shortest DM (214.33). In contrast, cultivated types from Europe had the longest DH (189.05 days) and DM (224.82 days). On the other hand, wild types from Asia had the highest PH (123.33 ㎝) and CL (112.92 ㎝), whereas cultivated types from Oceania had the lowest PH (70.53 ㎝) and CL (61.67 ㎝). Cultivated types from Asia also had the shortest SL (6.65 ㎝) and AL (10.49 ㎜), but the highest GPS (55.02) and the lowest TGW (38.58 g). Wild types from North America and Africa had the longest SL (10.47 ㎝) and AL (16.72 ㎜), respectively. Wild types from North America also exhibited the lowest GPS (18.60), but the highest TGW (52.78 g). In summary, wild barley from North America and cultivated barley from Asia displayed distinct and contrasting traits. The results indicated the diverse agronomic performances of different barley genotypes within and across origins. These findings further underscore the importance of genotype and origin in selecting barley accessions with desirable qualities. The observed results could also initiate genomic studies to explore the variations observed at the molecular levels (Iannucci et al., 2021; Liu et al., 2015; Rehman et al., 2021; Verma et al., 2021).
HCA, PCA, and Pearson’s correlation analysis
Multivariate analysis tools help to view the associations between crop genetic materials and phenotypic traits, as well as their distribution patterns (Benlioglu et al., 2024; Cho et al., 2025). In this study, the entire quantitative data was scaled and analyzed by HCA, PCA, and Pearson’s correlation analysis. The HCA grouped the accessions into 18 distinct clusters (Fig. 3a) and all traits showed significant variations (Supplementary Table 3). On average, accessions in cluster X were late maturing, whereas those in cluster XV were early maturing. Clusters XVII and VIII showed contrasting PH, CL, and SL. Similarly, clusters VII and XVI exhibited contrasting TGW, whereas clusters XII and XIII exhibited contrasting GPS. Interestingly, accessions in clusters I to XII were exclusively cultivated types. Among these, clusters II, VII, and IX consisted entirely of Asian accessions, having one accession from North America. In contrast, cluster XII had the entire accession from Europe, with only one accession from Asia. Furthermore, clusters XV, XVII, and XVIII were predominantly wild types with different number of accessions from two or more continents. The HCA generally categorized the barley accessions based on their agronomic performance. The distinct grouping of accessions by type and continent further highlighted the interaction effect of these factors on the traits studied (Supplementary Table S3). The PCA results further supported the HCA findings. In the PCA, the first two principal components explained over 50.00% of the total variance. The score plot on these principal components aligned with the HCA clusters (Supplementary Fig. 1). The genotype-based score plot separated wild types from cultivated types (Fig. 3b). Similarly, the continent-based score plot revealed distinct groupings, with European accessions, in particular, forming a separate cluster (Fig. 3c). Based on factor loading analysis, the variance along the first principal component was mainly contributed by SL (23.70%), AL (21.65%), GPS (13.27%), and TGW (18.63%). In contrast, the second principal component was influenced by DH (24.98%) and DM (28.75%). PH and CL had notable contributions to both components. Overall, factor loading of all traits exceeded ±0.50 (Table 4, Fig. 3d). These observations highlight their contributions to the variances observed along the first two principal components (Benlioglu et al., 2024; Cho et al., 2025).
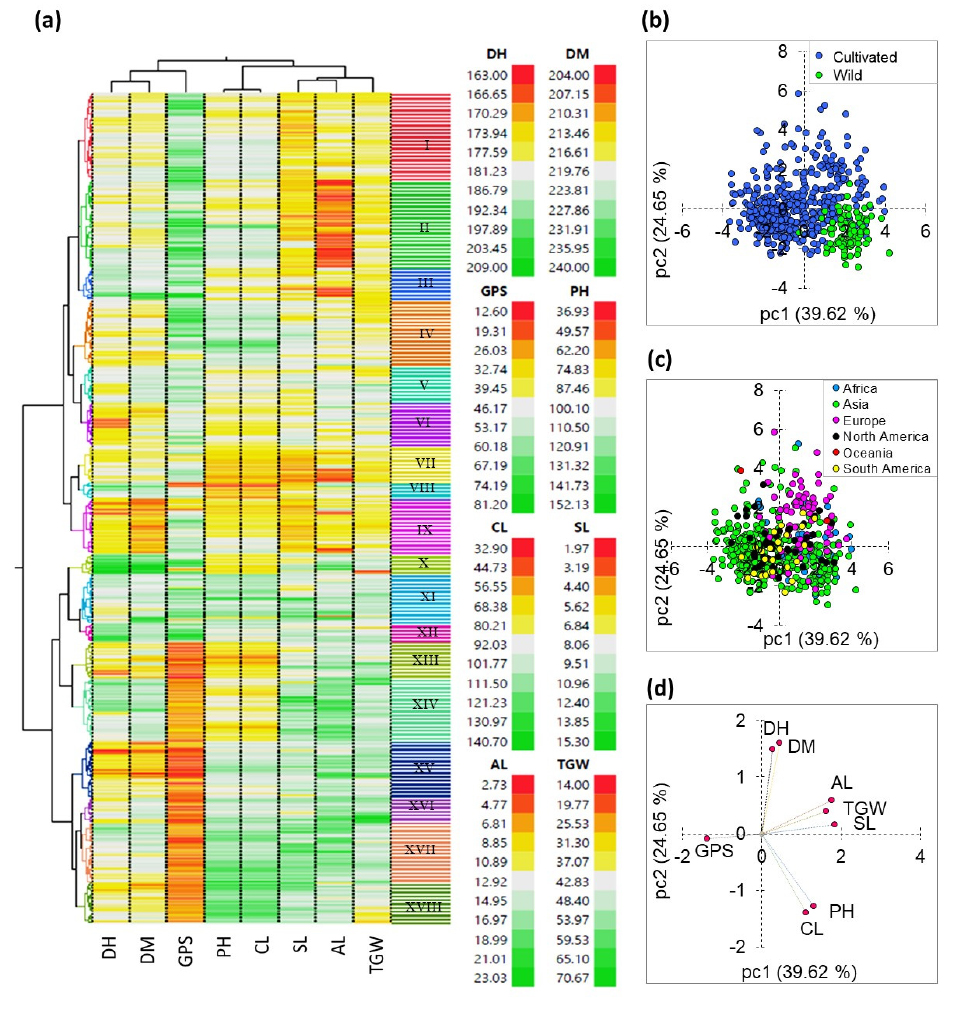
Fig. 3.
Two-way hierarchical cluster analysis (A), score plot of barley accessions according to their type (B) and origin (C), and loading plots of quantitative variables (D). AL: Awn length; CL: Culm length; DH: Days to heading; DM: Days to maturity; GPS: Grain per spike; SL: Spike length; TGW: One-thousand grain weight.
Table 4.
Factor loadings and contributions of quantitative traits in seven principal components.
| Component | Contribution | DHw | DMv | PHu | CLt | SLs | ALr | GPSq | TGWp | Eigenvalue |
Variance (%) |
Cumulative variance (%) |
| pc1 | FL | 0.13 | 0.21 | 0.62 | 0.53 | 0.87 | 0.83 | -0.65 | 0.77 | 3.17 | 39.62 | 39.62 |
| % | 0.54 | 1.43 | 11.99 | 8.80 | 23.70 | 21.65 | 13.27 | 18.63 | ||||
| pc2 | FL | 0.70 | 0.75 | -0.60 | -0.65 | 0.08 | 0.28 | -0.04 | 0.19 | 1.97 | 24.65 | 64.26 |
| % | 24.98 | 28.75 | 18.56 | 21.64 | 0.30 | 3.94 | 0.08 | 1.75 | ||||
| pc3 | FL | 0.58 | 0.51 | 0.50 | 0.53 | 0.04 | -0.24 | 0.60 | -0.28 | 1.61 | 20.06 | 84.33 |
| % | 20.65 | 15.96 | 15.55 | 17.18 | 0.08 | 3.65 | 22.19 | 4.74 | ||||
| pc4 | FL | -0.02 | 0.01 | 0.01 | 0.05 | -0.29 | -0.09 | 0.18 | 0.53 | 0.41 | 5.16 | 89.49 |
| % | 0.08 | 0.04 | 0.03 | 0.69 | 20.67 | 2.15 | 7.47 | 68.88 | ||||
| pc5 | FL | -0.30 | 0.09 | -0.06 | -0.10 | 0.29 | 0.09 | 0.40 | 0.05 | 0.36 | 4.54 | 94.03 |
| % | 24.50 | 2.09 | 0.91 | 2.96 | 23.53 | 2.45 | 42.97 | 0.59 | ||||
| pc6 | FL | 0.17 | -0.26 | -0.01 | 0.00 | -0.09 | 0.32 | 0.18 | -0.04 | 0.25 | 3.11 | 97.14 |
| % | 12.25 | 27.84 | 0.06 | 0.00 | 3.35 | 42.39 | 13.47 | 0.65 | ||||
| pcz7 | FLx | 0.20 | -0.23 | -0.03 | -0.07 | 0.25 | -0.23 | 0.04 | 0.10 | 0.23 | 2.86 | 100.00 |
| %y | 17.00 | 23.89 | 0.45 | 2.18 | 27.39 | 23.78 | 0.55 | 4.76 |
Pearson’s correlation analysis also revealed some distinct trait associations in wild and cultivated types (Fig. 4). Regardless of genotype difference, DH and DM showed a strong and positive correlation with each other (r > 0.70, p < 0.001). Furthermore, GPS had strong and negative correlations with AL and TGW (r ≥ 0.44, p &01). The strong and positive correlation between PH and CL (r = 0.99, p &01) was also independent of genotype difference. These results were in agreement with previous studies (Benlioglu et al., 2024; Verma et al., 2021). Previous studies also observed some contrasting correlation patterns in wild and cultivated barley types (Acevedo et al., 1991; Akdogan et al., 2025; Hosseini et al., 2019; Khera et al., 2025). In this study, GPS and SL showed a positive correlation in wild types (r = 0.34) and a negative correlation in cultivated types (r = -0.36). Similarly, TGW was negatively correlated with CL (r = -0.44) and PH (r = -0.42) in wild accessions, but weakly correlated in cultivated types. SL and AL were not significantly correlated in wild genotypes (r = -0.06) but showed a strong and positive correlation in cultivated types (r = 0.68, p &01). The correlation between SL and TGW was also strong in cultivated types (r = 0.55, p &01) and weak in wild types (r = 0.03). The overall results signified that wild types could be ideal for selections targeting grain number and spike length, while cultivated varieties could be preferable for selections focusing on grain weight and spike length simultaneously. This distinction highlights the complementary breeding potential of both types for yield-related trait improvement (Asfaw et al., 1990; Hebbache et al., 2024).
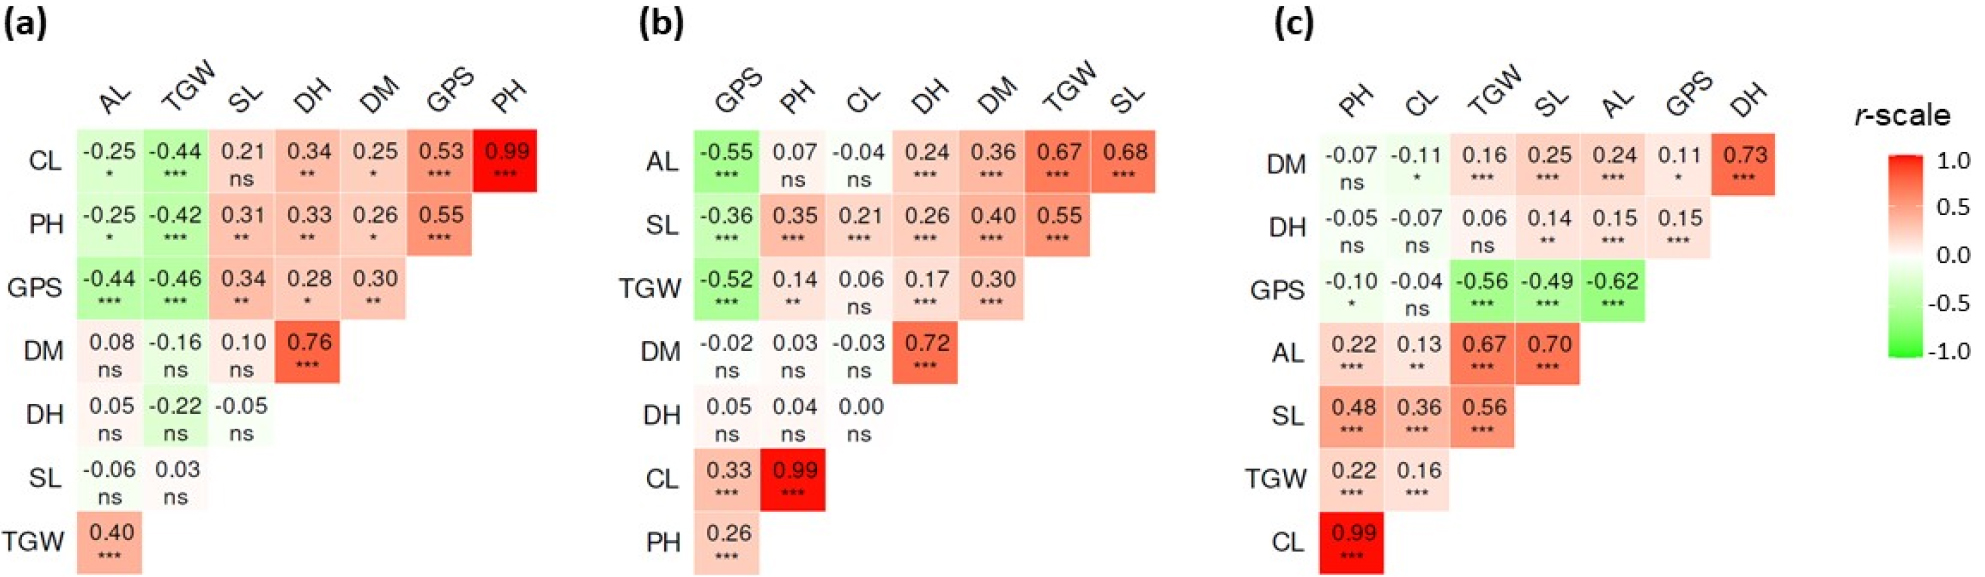
Fig. 4.
Pearson’s correlation matrix of quantitative variables in wild barley type (a), cultivated barley type (b), and the whole population (c). AL: Awn length; CL: Culm length; DH: Days to heading; DM: Days to maturity; GPS: Grain per spike; SL: Spike length; TGW: One-thousand grain weight. *p &5, **p &1, ***p &01, nsNot significant.
In summary, this study revealed a broad diversity in some of the key agronomical traits across a large collection of barley genotypes and identified the best-performing accessions. Moreover, the results showed clear variations in both qualitative and quantitative agronomical traits between wild and cultivated barley genotypes from different origins. Wild barley types were characterized by an intermediate growth habit, horizontal flag leaf, erect spike attitude, two-row spikes, hulled grains, shorter plant and culm lengths, fewer grains per spike, and lighter grains. In contrast, cultivated types displayed wide variability in growth habit, spike attitude, and grain type. They also headed and matured earlier, grew taller, produced more grains per spike, and had heavier grains than wild types. Trait distribution also varied across continents and reflected the interaction between origin and genotype. Overall, this study underscores the wide range of phenotypic variations in wild and cultivated barley genotypes from different origins. The observed diversity could provide valuable insights for targeted selection of barley accessions. Moreover, the variation in growth and yield-related traits could serve as a basis for future genetic studies, ultimately supporting breeding programs aimed at improving specific agronomic traits.
