

Introduction
Materials and Methods
Chemicals and reagents
Plant materials collection and sample preparation
Analysis of vitamin C using high-performance liquid chromatography (HPLC)
Fatty acid analysis and lipid quality
Determination of total phenol, total tannin, and total saponin contents
Determination of antioxidant capacity
Statistical analysis
Results and Discussion
Variation of vitamin C content
Fatty acids and lipid quality
Total phenol, total tannin, and total saponin contents
Antioxidant activities
Cluster, principal component, and correlation analyses
Introduction
The genus Vigna includes over 100 species that are economically important across various regions, including Africa, Asia, North America, and Europe (Choi et al., 2013; Shubha et al., 2022). As members of the legume (Fabaceae) family, Vigna species can fix nitrogen through a symbiotic relationship with soil bacteria, making them beneficial for enriching agricultural soil (Chongtham et al., 2022). Due to this ability, they are commonly used in intercropping systems to enhance yield-related traits in different crops (Kussie et al., 2024; Senghor et al., 2023).
In addition to their role in sustainable agriculture, Vigna species are known for their nutritional benefits and health- promoting properties (Abebe and Alemayehu, 2022). Many Vigna species are important sources of protein, minerals, fiber, fatty acids, and vitamins (Flyman and Afolayan, 2008). They also contain various secondary metabolites, such as phenols, anthocyanins, saponins, alkaloids, and tannins, which are associated with health-promoting properties including antioxidant, anti-inflammatory, and anticancer effects (Abebe and Alemayehu, 2022; Gutiérrez-Uribe et al., 2011; Nassourou et al., 2016; Razgonova et al., 2022; Sardar et al., 2024). These qualities have increased the popularity of Vigna species in both food industries and breeding programs. V. unguiculata (L.) is one of the Vigna species widely cultivated globally and consists of five subspecies. In particular, two of its subspecies are popular and extensively grown. One of the subspecies, V. unguiculata (L.) Walp. ssp. unguiculata (cowpea), is widely cultivated and consumed across Africa, Asia, and America (Orberá Ratón et al., 2021; Wu et al., 2022). In contrast, the other subspecies, V. unguiculata (L.) Walp. ssp. sesquipedalis (yardlong bean), is mainly cultivated and consumed in East and Southeast Asia (Zhang et al., 2020).
Yardlong beans, also known as vegetative cowpea or asparagus beans, are known for their long and tender pods. They are popular in Korea, Japan, China, and Thailand, and are consumed either cooked, raw, or combined with other dishes (Tae et al., 2010; Tantasawat et al., 2010; Xia et al., 2019). In addition to their nutritional benefits and health-promoting properties, yardlong beans are adaptable to different climatic conditions. This makes them suitable for regions impacted by climate change (Liang et al., 2022; Orberá Ratón et al., 2021; Zhang et al., 2021). As a result, interest in the cultivation and utilization of yardlong beans is growing beyond Asia. The recent registration of four pest-resistant yardlong bean germplasm lines in the US highlights this trend in Western and North American countries (Huynh et al., 2024; Niu et al., 2021). Despite their desirable traits and increasing popularity, however, there is limited research on the nutritional and bioactive metabolites of yardlong beans. This makes them one of the least studied and underutilized legumes (Dwivedi et al., 2023; Pidigam et al., 2021). Additionally, the development of improved yardlong bean cultivars through breeding has not progressed as rapidly as other legumes. This might be, in part, due to the lack of a large collection of yardlong bean genetic materials that provide insight into their genetic diversity (Liang et al., 2022; Tantasawat et al., 2010; Yu et al., 2023). To fully utilize the potential of yardlong beans and address the dietary needs of a growing global population, it is essential to explore their diversity not only in terms of yield-related traits but also in terms of their biochemical compositions (Zhang et al., 2024). Accordingly, this study focused on analyzing the levels of vitamin C, five key fatty acids (palmitic acid [16:0], stearic acid [18:0], oleic acid [18:1], linoleic acid [18:2], and linolenic acid [18:3]), lipid quality, total phenol, total saponin, total tannin, and antioxidant activities (DPPH• scavenging activity, ABTS•+ scavenging activity, and reducing power) across 64 yardlong bean accessions recently grown in Korea. Unlike other legumes, such as mung beans and soybeans, there is no known local cultivar of yardlong bean in Korea. In this study, Sinseondu, a popular local common bean cultivar, was used as a control to assess the relative performances of the yardlong bean accessions. The findings of this study may offer valuable insights into the biochemical diversity of yardlong beans and initiate future research on developing functional foods derived from them. Additionally, the study could enhance the understanding of the potential and benefits of yardlong beans in breeding programs aimed at improving their use in agriculture and the food industry.
Materials and Methods
Chemicals and reagents
The chemicals and reagents used in this study were analytical grade and used as received. With the exception of ethanol and sulfuric acid, which were ordered from Fisher Scientific (Pittsburgh, PA, USA), all other chemicals and reagents were obtained from Sigma-Aldrich (St. Louis, MO, USA).
Plant materials collection and sample preparation
The cultivation of 64 yardlong bean accessions, along with the control common bean cultivar (Sinseondu), was conducted at the National Agrobiodiversity Center, Rural Development Administration (Jeonju, Republic of Korea) during the 2022 growing season. Details of the cultivation process and growing condition were outlined in a previous study (Choi et al., 2024a). Both immature pods (at full green stage) and mature seeds were hand-harvested, freeze-dried using an LP500 freeze dryer (ilShinBioBase, Dongducheon, Korea), and subsequently ground into powder. The immature pod samples were analyzed for vitamin C content, secondary metabolite contents, and antioxidant activities, while the seed samples were evaluated for fatty acid levels and lipid quality. All analyses were performed within 72 hours of sample preparation, and any unused sample was stored at –20°C. Appendix 1 presents the list of the yardlong bean accessions and their registration number (introduction or temporary number) as documented in our gene bank at the National Agrobiodiversity Center, Rural Development Administration (Jeonju, Republic of Korea).
Analysis of vitamin C using high-performance liquid chromatography (HPLC)
Vitamin C was extracted using a solution of 3% metaphosphoric acid and ethanol in an 8:2 ratio (Choi et al., 2024a, 2024b). Initially, 1 g of powdered sample was placed in a 15 mL extraction tube and mixed with 10 mL of the solvent. The mixture was shaken for 45 min in an ice bath at 4°C, protected from light, and then centrifuged at 3134×g for 10 min at 4°C. The supernatant was collected, filtered, and prepared for subsequent analysis. Vitamin C was quantified using a 1260-infinity Quaternary High-performance Liquid Chromatography (HPLC) system (Agilent Technologies, Santa Clara, CA, USA) connected to a diode-array detector (DAD) and a Zorbax SB-18 column (4.6 × 250 ㎜, 5 ㎛) which was kept at 30°C. The mobile phase consisted of water with 0.1% trifluoroacetic acid (A) and methanol (B), with a gradient starting at 5% methanol (B) for 10 min, increasing to 50%, and then returning to 5% B over another 10 min. The post run time was 5 min and the chromatogram was monitored at 245 ㎚. The vitamin C content (㎎/g) was quantified using L-ascorbic acid as a reference standard.
Fatty acid analysis and lipid quality
Fatty acids were analyzed by preparing fatty acid methyl esters (FAMEs) using a direct methylation method (Choi et al., 2024a). Briefly, 0.2 g of powdered sample was mixed with 680 μL of a solvent mixture composed of methanol, benzene, 2,2-dimethoxypropane, and sulfuric acid (in a 39:20:5:2 ratio) in a 10 mL round-bottom glass tube with a screw cap. Following this, 400 µL of n-heptane was added, and the mixture was vortexed. The extraction process took place in a shaking water bath set to 80°C for 2 hours. After cooling to 25°C, the mixture was centrifuged for 15 min. The upper n-heptane layer containing the FAMEs was then filtered and analyzed using a QP2010 GC-FID system (Shimadzu, Kyoto, Japan) fitted with an HP-INNOWAX column (30 m × 0.250 ㎜, 0.25 ㎛). Fatty acid analysis was performed on the QP2010 gas chromatography-flame ionization detector (Shimadzu, Kyoto, Japan) using the same HP-INNOWAX column. The temperature gradient began at 100°C, rising to 170°C at a rate of 60°C/min. After 1 min of holding time, the temperature was increased to 240°C at 6.5°C/min and held for an additional minute. Fatty acids were identified by comparing retention times with those of external standards. The content of each fatty acid was determined from the peak area percentages, averaged from triplicate measurements. Equations (1) and (2) were used to determine the lipid quality indices, including the atherogenicity index (IA) and thrombogenicity index (IT), respectively. In these equations, PUFA refers to the total polyunsaturated fatty acid content, while MUFA indicates the total monounsaturated fatty acid content.
The double bond index (DBI), which is used to estimate the unsaturated fatty acid proportion and the stability of oil, was also determined using equation 3.
Determination of total phenol, total tannin, and total saponin contents
To quantify the total secondary metabolite content, samples were prepared following a method described in a previous study (Choi et al., 2024a). Specifically, 0.5 g of powdered sample was mixed with 5 mL of 80% aqueous ethanol in a 15 mL extraction tube. The mixture was ultra-sonicated in a water bath for 45 min at 25°C. After centrifugation (3134×g, 10 min), the upper layer was collected, and the remaining residue was subjected to a second round of extraction with 2.5 mL of the solvent. The combined supernatant was used to measure the total secondary metabolite levels. The total phenolic content was assessed using the Folin-Ciocalteu method and expressed as milligrams of gallic acid equivalents per gram of dry sample weight (㎎ GAE/g). Likewise, total tannin content was evaluated using the vanillin-hydrochloric acid method and it was presented as milligrams of catechin equivalents per gram of dried sample weight (㎎ CE/g). The vanillin-sulfuric acid assay was used to determine the total saponin content and it was reported as milligrams of diosgenin equivalents per gram of dried sample (㎎ DE/g). In each case, absorbance was recorded using an Eon Microplate Spectrophotometer (Bio-Tek, Winooski, VT, USA).
Determination of antioxidant capacity
The extracts prepared for the determination of total metabolite contents were also utilized to assess the antioxidant capacity of each accession using three independent colorimetric assays (Choi et al., 2024a). For each assay, antioxidant activity was calculated using equation (4), where C, V, Df, and m represent the concentration (㎎/mL) of the sample corresponding to the calibration curve of the standard (STD), sample volume (mL), dilution factor, and sample weight (g), respectively.
In summary, the DPPH• scavenging activity and reducing power were expressed in milligrams of ascorbic acid equivalents per gram of dried sample weight (㎎ AAE/g) using ascorbic acid as a reference standard. The ABTS•+ scavenging activity was determined in milligrams of Trolox equivalents per gram of dried sample weight (㎎ TE/g) using Trolox as a standard.
Statistical analysis
In this study, mean and standard deviation (SD) values were presented from triplicate measurements. Statistical analysis was conducted using analysis of variance (ANOVA), followed by Duncan’s multiple range test, with a level of significance set at p < 0.05. XLSTAT software version 2019.2.2 (Lumivero, CO, USA) was used for statistical analysis. Cluster and principal component analyses were conducted using JMP Pro software version 17 (SAS, Inc., Cary, North Carolina, USA), while Pearson’s correlation analysis was performed using R software version 4.2 (R-project).
Results and Discussion
Variation of vitamin C content
The vitamin C content in each of the studied accessions was analyzed using HPLC instrument as previously described. The result showed that the vitamin C content ranged from 0.31 ㎎/g to 4.18 ㎎/g, with an average of 2.28 ㎎/g (Fig. 1a). This range represents more than a ten-fold variation and signifies a wide diversity among the accessions with a coefficient of variation (CV) of 37.23%. Recently, Zhang el al. (2024) found a vitamin C content ranging from 4.61-6.92 ㎎/100g in a Chinese yardlong bean cultivar grown under different cultivation conditions. In another study, a vitamin C content ranging from 18.20 to 202.22 ㎎/100g was reported across five Bangladesh yardlong bean accessions (Quamruzzaman et al., 2022). Compared to these values, a much lower vitamin C level was reported in cowpea genetic materials where sprouting (germination or malting) is usually recommended to maximize their nutritional qualities (Devi et al., 2015; Doblado et al., 2007). Overall, the reported results indicate the wide-ranging values of vitamin C levels in yardlong bean genetic materials which could be attributed to differences in genotype, plant parts analyzed, and cultivation conditions, among others (Chongtham et al., 2022; Farooq et al., 2018; Gerrano et al., 2022).
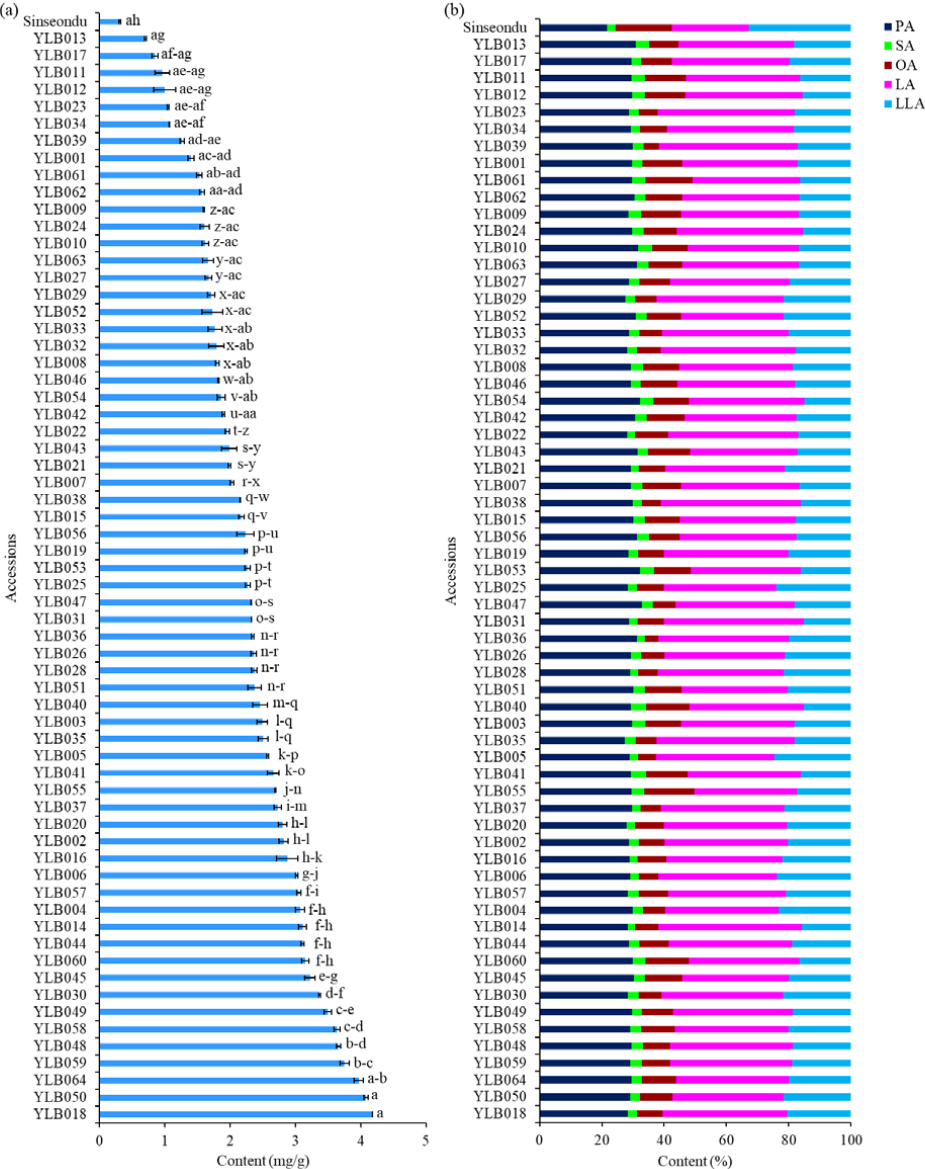
Fig. 1.
The levels of vitamin C (a) and individual fatty acids across 64 yardlong bean accessions and the control cultivar. PA: Palmitic acid, SA: Stearic acid, OA: Oleic acid, LA; Linoleic acid, LLA: Linolenic acid. Different unpaired (a-z) and paired (aa-ah) small letters on bars indicate significantly different mean values.
Statistical analysis was also conducted to assess the relative performance of the yardlong bean accessions in comparison to the control cultivar and among themselves. Accordingly, all the accessions had a significantly higher vitamin C level than Sinseondu cultivar (p < 0.05). The highest vitamin C content was found in accession YLB018, followed by YLB050 (4.08 ㎎/g) and YLB064 (3.97 ㎎/g). Additionally, 48.44% of the accessions were found to have a higher vitamin C level than the average value (Fig. 1a). The consumption of foods rich in vitamin C has been associated with a reduction in metabolic syndrome, a condition closely linked to chronic diseases such as liver disease, heart disease, and diabetes, among others (Traber et al., 2019). Since many types of legumes are not rich in vitamin C, it is crucial to explore underutilized legumes as potential sources of this nutrient (Amarowicz and Pegg, 2008; Anwar et al., 2024; Moriyama and Oba, 2008). Accordingly, this study identified six accessions including YLB018, YLB050, YLB064, YLB059, YLB048, and YLB058, with a significantly higher level of vitamin C level (> 3.50 ㎎/g) than 97% of the studied accessions (Table 1). These yardlong bean accessions could, therefore, be considered good sources of vitamin C.
Table 1.
Characteristics of sixteen yardlong bean accessions selected for their performance.
| Parameter | Accession | Introduction/Temporary number | Value |
| Vitamin C | YLB018 | 801429 | 4.18 ± 0.03 ㎎/g |
| YLB048 | K131547 | 3.66 ± 0.04 ㎎/g | |
| YLB050 | K146061 | 4.08 ± 0.07 ㎎/g | |
| YLB058 | K243733 | 3.64 ± 0.06 ㎎/g | |
| YLB059 | K243957 | 3.75 ± 0.03 ㎎/g | |
| YLB064 | K262409 | 3.97 ± 0.07 ㎎/g | |
|
TTCr; TSCs | YLB006 | 181266 |
23.19 ± 0.79 ㎎ CE/g; 25.08 ± 1.21 ㎎ DE/g |
| YLB057 | K214085 |
23.27 ± 0.66 ㎎ CE/g; 23.60 ± 1.88 ㎎ DE/g | |
|
DPPHt; ABTSu; RPv | YLB001 | 160313 |
9.38 ± 0.78 ㎎ AAE/g; 20.64 ± 1.38 ㎎ TE/g; 13.42 ± 0.19 ㎎ AAE/g |
| YLB002 | 164813 |
11.48 ± 0.51 ㎎ AAE/g; 21.91 ± 1.07 ㎎ TE/g; 12.26 ± 0.71 ㎎ AAE/g | |
| YLB029 | 910032 |
8.15 ± 0.92 ㎎ AAE/g; 21.39 ± 1.82 ㎎ TE/g; 13.86 ±1.89 ㎎ AAE/g | |
| YLB033 | 910184 |
10.02 ± 0.66 ㎎ AAE/g; 21.63 ± 0.89 ㎎ TE/g; 12.69 ± 0.74 ㎎ AAE/g | |
| YLB038 | K002983 |
11.68 ± 1.09 ㎎ AAE/g; 22.88 ± 2.12 ㎎ TE/g; 15.01 ± 1.73 ㎎ AAE/g | |
| IAw; ITx | YLB029 | 910032 | 0.40; 0.33 |
| TUFA:TSFAy; DBIz | YLB010 | 189670 | 1.77; 133.15 |
| YLB053 | K163016 | 1.72; 130.83 | |
| YLB054 | K164661 | 1.74; 130.58 |
Fatty acids and lipid quality
Legumes, in general, are known to contain fatty acids that have different degrees of unsaturation. This in turn determines their wide-ranging health benefits and lipid quality (Caprioli et al., 2016; Shi et al., 2014). In this study, the five target fatty acids were found in all the studied accessions and showed significant variations (Fig. 1b, p < 0.05). Specifically, the levels of palmitic acid and stearic acid were in the ranges of 21.69-32.84% and 2.30-4.87%, respectively, resulting in a total saturated fatty acid content (TSFA) ranging from 24.47% to 36.72% (Table 1). Likewise, the levels of oleic acid (n-9), linoleic acid (n-6), and linolenic acid (n-3) ranged from 4.23% to 18.04%, 24.66% to 46.02%, and 15.03% to 32.83%, respectively. These values resulted in a total polyunsaturated fatty acid (PUFA) content ranging from 50.21% to 62.63% and a total unsaturated fatty acid (TUFA) content ranging from 63.28% to 75.53% (Table 2). The highest CV was observed in oleic acid (28.01%), while the lowest was found in palmitic acid (5.02%). Overall, palmitic acid was the dominant unsaturated fatty acid in all the yardlong bean accessions while linoleic acid was the dominant unsaturated fatty acid. Similar findings were reported in previous studies conducted on yardlong beans, cowpeas, and other legumes such as lentil and faba bean genetic materials (Antova et al., 2014; Caprioli et al., 2016; Perchuk et al., 2020). Compared to the control cultivar, all the yardlong bean accessions showed significantly lower palmitic acid, oleic acid, and linolenic acid levels (p < 0.005). Likewise, all the accessions had a significantly higher linoleic acid level, while only ten accessions had a lower stearic acid content (Fig. 1b). The observed differences in the levels of essential fatty acids, such as omega-3 (linolenic acid) and omega-6 (linoleic acid), also highlight the variation in lipid quality among the yardlong bean accessions (Salgado et al., 2023).
Table 2.
Statistics of total fatty acid contents and lipid quality parameters.
| Variable | Minimum | Maximum | Mean (SD) | CV (%) | p-value |
| TSFAu (%) | 24.47 | 36.72 | 32.88 (1.79) | 5.45 | <0.001 |
| TUFAv (%) | 63.28 | 75.53 | 67.12 (1.79) | 2.67 | <0.001 |
| PUFAw (%) | 50.21 | 62.63 | 57.21 (3.50) | 6.12 | <0.0001 |
| TUFA/TSFA | 1.72 | 3.09 | 2.05 (0.18) | 8.98 | <0.0001 |
| n-3/n-6 | 0.34 | 1.33 | 0.51 (0.13) | 25.04 | <0.0001 |
| DBIx | 130.58 | 165.85 | 143.34 (6.92) | 4.82 | <0.05 |
| IAy | 0.29 | 0.52 | 0.44 (0.03) | 7.37 | <0.001 |
| ITz | 0.19 | 0.48 | 0.38 (0.04) | 11.56 | <0.001 |
Essential fatty acids play a significant role in reducing cardiovascular diseases, inflammation, and neurodegenerative diseases, among others. To preserve these health benefits, it is important to maintain a proper balance between omega-3 and omega-6 fatty acids (Salgado et al., 2023). In this context, lipid quality parameters such as IT, IA, and the n-3/n-6 ratio (or n-6/n-3 ratio) are crucial (Morshedloo et al., 2022; Tilami and Kouřimská, 2022). In this study, IA and IT were the lowest in the control cultivar (Table 2). In contrast, the n-3/n-6 ratio was the highest owing to the higher level of linolenic acid compared to the yardlong bean accessions. Although all the yardlong bean accessions had poor lipid quality compared to the control cultivar, accession YLB029 exhibited both lower IA (0.40) and IT (0.33), making it an ideal candidate as a source of healthy lipid (Table 1) (Kouřimská et al., 2021; Morshedloo et al., 2022; and Kouřimská, 2022). On the other hand, unsaturated fatty acids are susceptible to oxidation causing oil rancidity and unpleasant flavor (Goli et al., 2013). Accordingly, accessions YLB053, YLB054, and YLB010, which exhibited lower DBI and TUFA/TSFA ratios, could be good sources of oil with prolonged shelf-life (Table 1) (Morshedloo et al., 2022).
Total phenol, total tannin, and total saponin contents
The total secondary metabolite contents of all the studied accessions are presented in Table 3. The yardlong bean accessions displayed significant variation (p < 0.05) in all contents. Total phenol, total tannin, and total saponin contents were in the ranges of 2.98-9.51 ㎎ GAE/g, 23.19-941.49 ㎎ CE/g, and 21.78-92.72 ㎎ DE/g, respectively. Each of these ranges exhibited a coefficient of variation exceeding 22%. Unlike cowpea genetic materials, studies on the levels of total secondary metabolite contents in yardlong bean genetic materials are scarce (Carvalho et al., 2021; Karapanos et al., 2017; Tungmunnithum et al., 2021). The available literature also reported a wide range of values which once again could be attributed to the differences in extraction method, genotype, and environmental conditions (Gutiérrez-Uribe et al., 2011; Lee et al., 2023; Perchuk et al., 2020). Compared to the control cultivar, most of the yardlong bean accessions exhibited significantly higher total phenol, total saponin, and total tannin contents. Specifically, all the yardlong bean accessions had a higher total phenol content than the control cultivar (2.98 ㎎ GAE/g) (Table 3). Likewise, only three accessions including YLB006, YLB057, and YLB026, had a significantly lower total tannin content than Sinseondu (26.41 ㎎ CE/g). Furthermore, fifteen accessions exhibited a lower total saponin content than Sinseondu (35.82 ㎎ DE/g), although the observed variations were not statistically significant (Table 3). Legume polyphenols, in general, provide numerous health benefits, such as antioxidant, anti-inflammatory, anticancer, and anti-aging effects, which makes accessions with higher polyphenol levels valuable genetic resources (Abebe and Alemayehu, 2022; Gutiérrez-Uribe et al., 2011; Lee et al., 2021). Conversely, phenols could act as anti-nutrient factors since they cause a reduction in protein and starch digestibility (Arinathan et al., 2003; Padhi et al., 2022). Likewise, tannins and saponins are undesirable in legumes due to their anti-nutrient properties and unpleasant taste (Singh et al., 2023). In this context, accessions YLB057 and YLB006, which simultaneously exhibited lower total tannin and total saponin contents, could be of particular importance (Table 2). It is highly recommended that future studies should prioritize identifying specific metabolites with such undesirable characteristics through metabolomics research (Dinore et al., 2023; Sardar et al., 2024).
Table 3.
Total secondary metabolite contents and antioxidant activity of 64 yardlong bean accessions and a control cultivar.
| Accession | Total metabolite content | Antioxidant activity | |||||
|
TPCz (㎎ GAE/g) |
TTCy (㎎ CE/g) |
TSCx (㎎ DE/g) |
DPPHw (㎎ AAE/g) |
ABTSv (㎎ TE/g) |
RPu (㎎ AAE/g) | ||
| YLB001 | 6.88 ± 0.28d-jt | 56.52 ± 4.07h-r | 65.54 ± 1.61e-h | 9.38 ± 0.78b-c | 20.64 ± 1.38b | 13.42 ± 0.19b-c | |
| YLB002 | 7.06 ± 0.25c-i | 941.49 ± 41.97a | 59.64 ± 4.37g-j | 11.48 ± 0.51a | 21.91 ± 1.07a-b | 12.26 ± 0.71c-d | |
| YLB003 | 4.89 ± 0.34u-aa | 68.27 ± 2.66g-n | 40.21 ± 4.57m-z | 4.97 ± 0.79i-n | 9.84 ± 1.34j-l | 5.24 ± 0.78n-r | |
| YLB004 | 4.49 ± 0.39y-ac | 59.55 ± 2.77h-q | 36.52 ± 5.94o-ad | 4.32 ± 0.44n-q | 8.43 ± 0.74k-q | 4.72 ± 0.50o-u | |
| YLB005 | 5.38 ± 0.28p-y | 33.75 ± 2.72p-u | 34.88 ± 0.58r-ad | 4.26 ± 0.54n-r | 8.43 ± 0.44k-q | 5.75 ± 0.24m-q | |
| YLB006 | 4.22 ± 0.11aa-ad | 23.19 ± 0.79u | 25.08 ± 1.21aa-ad | 2.12 ± 0.08w-y | 5.14 ± 0.20w-ab | 2.62 ± 0.20w-y | |
| YLB007 | 6.25 ± 0.33h-p | 57.99 ± 2.08h-q | 41.12 ± 2.83l-z | 4.76 ± 0.32j-o | 8.58 ± 0.71k-o | 4.81 ± 0.38o-t | |
| YLB008 | 6.58 ± 0.12d-l | 59.93 ± 0.39h-q | 43.15 ± 0.79k-x | 5.48 ± 0.19i-k | 10.32 ± 0.11i-k | 5.38 ± 0.34m-r | |
| YLB009 | 5.40 ± 0.09o-x | 45.97 ± 1.04k-u | 34.04 ± 2.11s-ad | 2.60 ± 0.34u-y | 5.77 ± 0.65u-z | 2.90 ± 0.36v-y | |
| YLB010 | 6.63 ± 0.14d-l | 194.43 ± 6.98c | 65.70 ± 0.61e-g | 6.50 ± 0.25g-h | 12.57 ± 0.58f-h | 8.45 ± 0.17h-j | |
| YLB011 | 6.94 ± 0.45d-j | 76.36 ± 3.90f-j | 75.17 ± 2.04b-d | 8.04 ± 0.78d-e | 15.73 ± 0.94c-e | 10.74 ± 0.17e-f | |
| YLB012 | 4.78 ± 0.39v-ab | 40.70 ± 3.74o-u | 58.50 ± 1.84h-j | 4.46 ± 0.34l-p | 8.87 ± 1.03k-m | 5.07 ± 0.69n-s | |
| YLB013 | 7.29 ± 0.22c-f | 78.44 ± 0.93e-i | 58.07 ± 2.88d-k | 5.35 ± 0.08i-l | 13.86 ± 0.26e-g | 8.31 ± 0.47h-j | |
| YLB014 | 6.71 ± 0.18d-k | 43.18 ± 0.00n-u | 68.32 ± 2.20d-e | 6.57 ± 0.42g-h | 15.31 ± 0.61c-e | 8.50 ± 0.42h-j | |
| YLB015 | 5.64 ± 0.34m-v | 56.59 ± 3.12h-r | 39.68 ± 0.44n-aa | 4.54 ± 0.21k-o | 10.23 ± 0.93i-k | 5.17 ± 0.27n-s | |
| YLB016 | 5.42 ± 0.08o-w | 45.33 ± 0.71k-u | 79.13 ± 1.57b | 5.83 ± 0.20h-i | 11.67 ± 0.16h-j | 8.76 ± 0.19h-i | |
| YLB017 | 5.44 ± 0.24o-w | 41.00 ± 3.08n-u | 75.59 ± 7.86b-c | 4.92 ± 0.20i-n | 10.10 ± 1.60j-k | 8.24 ± 0.48h-j | |
| YLB018 | 7.46 ± 0.28b-d | 76.41 ± 1.08f-j | 80.48 ± 3.50b | 7.88 ± 0.24e-f | 15.09 ± 0.29c-e | 11.63 ± 0.10d-e | |
| YLB019 | 7.36 ± 0.40b-e | 71.33 ± 3.72g-m | 61.02 ± 1.62f-i | 7.04 ± 0.50f-g | 15.23 ± 1.05c-e | 8.00 ± 0.54i-j | |
| YLB020 | 7.17 ± 0.19c-g | 68.34 ± 2.55g-n | 70.98 ± 5.01c-e | 7.28 ± 0.36e-g | 14.42 ± 0.74d-f | 9.96 ± 0.58f-g | |
| YLB021 | 4.83 ± 0.25v-ab | 44.29 ± 0.68m-u | 40.57 ± 3.08m-z | 3.59 ± 0.15p-t | 9.15 ± 0.22k-m | 4.38 ± 0.27q-u | |
| YLB022 | 6.27 ± 0.16g-p | 52.88 ± 1.67h-s | 54.20 ± 1.01e-n | 5.34 ± 0.34i-l | 15.22 ± 0.47c-e | 7.98 ± 0.35i-j | |
| YLB023 | 5.44 ± 0.21o-w | 40.39 ± 3.52p-u | 49.11 ± 4.14h-s | 4.36 ± 0.42m-p | 12.89 ± 0.77f-h | 6.55 ± 0.50k-m | |
| YLB024 | 5.33 ± 0.17q-y | 37.11 ± 0.39p-u | 39.52 ± 1.66n-aa | 3.91 ± 0.15o-s | 9.16 ± 0.26k-m | 4.08 ± 0.08r-v | |
| YLB025 | 6.13 ± 0.34j-r | 39.87 ± 1.03p-u | 42.87 ± 2.98l-x | 5.60 ± 0.22i-j | 12.84 ± 0.03f-h | 7.25 ± 0.05j-l | |
| YLB026 | 3.97 ± 0.15ab-ad | 26.08 ± 1.35s-u | 42.09 ± 0.95l-y | 3.01 ± 0.32s-w | 7.93 ± 0.17o-s | 2.71 ± 0.08v-y | |
| YLB027 | 3.60 ± 0.06ad-ae | 49.16 ± 4.29j-u | 37.34 ± 0.26o-ac | 2.52 ± 0.07u-y | 6.82 ± 0.11r-v | 1.97 ± 0.14x-y | |
| YLB028 | 4.31 ± 0.18z-ad | 53.30 ± 2.06h-s | 23.82 ± 0.29ab-ad | 2.13 ± 0.06w-y | 5.75 ± 0.34u-z | 1.61 ± 0.20y | |
| YLB029 | 9.21 ± 0.64a | 91.10 ± 7.12e-g | 67.59 ± 7.04e-f | 8.15 ± 0.92d-e | 21.39 ± 1.82a-b | 13.86 ± 0.89b | |
| YLB030 | 3.64 ± 0.17ad-ae | 26.79 ± 0.99s-u | 21.78 ± 0.54ad | 2.83 ± 0.13t-x | 3.70 ± 0.21ab | 1.61 ± 0.14y | |
| YLB031 | 8.15 ± 0.54b | 92.19 ± 8.02e-g | 54.02 ± 4.26e-m | 8.75 ± 0.87c-d | 16.62 ± 1.71c | 9.36 ± 0.96g-h | |
| YLB032 | 7.80 ± 0.68b-c | 79.54 ± 6.91e-h | 77.92 ± 3.20b-c | 9.63 ± 0.78b | 20.42 ± 1.52b | 11.62 ± 0.26d-e | |
| YLB033 | 7.91 ± 0.28b-c | 93.25 ± 5.64e-g | 90.95 ± 12.19a | 10.02 ± 0.66b | 21.63 ± 0.89a-b | 12.69 ± 0.74b-d | |
| YLB034 | 5.24 ± 0.06r-y | 51.85 ± 2.45i-s | 54.93 ± 1.71e-m | 5.05 ± 0.30i-n | 12.93 ± 0.19f-h | 6.25 ± 0.30k-n | |
| YLB035 | 5.46 ± 0.38o-w | 72.15 ± 8.55g-l | 48.30 ± 2.32h-t | 4.97 ± 0.15i-n | 12.11 ± 0.93g-i | 5.82 ± 0.51m-p | |
| YLB036 | 4.73 ± 0.37w-ab | 71.89 ± 3.05g-l | 46.55 ± 6.44h-u | 3.05 ± 0.19s-w | 7.91 ± 0.29o-s | 3.01 ± 0.39v-x | |
| YLB037 | 5.20 ± 0.65s-y | 71.24 ± 7.58g-m | 30.86 ± 0.70v-ad | 2.66 ± 0.20t-x | 6.58 ± 0.63s-w | 6.01 ± 0.53l-o | |
| YLB038 | 9.51 ± 0.72a | 102.72 ± 11.49d-e | 92.72 ± 3.70a | 11.68 ± 0.09a | 22.88 ± 2.12a | 15.01 ± 0.73a | |
| YLB039 | 6.62 ± 0.13d-l | 51.14 ± 2.57i-s | 54.63 ± 0.19e-m | 7.31 ± 0.11e-g | 15.98 ± 0.30c-d | 10.19 ± 0.16f-g | |
| YLB040 | 5.25 ± 0.30r-y | 60.55 ± 2.61h-p | 50.47 ± 3.67g-p | 2.78 ± 0.32t-x | 8.49 ± 0.95k-p | 3.57 ± 0.37t-w | |
| YLB041 | 6.54 ± 0.48e-l | 60.84 ± 3.91h-p | 48.28 ± 0.92h-t | 3.44 ± 0.16q-u | 9.03 ± 0.50k-m | 7.49 ± 0.41i-k | |
| YLB042 | 5.22 ± 0.20r-y | 40.14 ± 1.02p-u | 51.15 ± 2.31f-o | 2.86 ± 0.03t-x | 7.49 ± 0.35p-t | 5.20 ± 0.09n-s | |
| YLB043 | 4.67 ± 0.14w-ac | 54.85 ± 0.77h-r | 43.87 ± 0.48j-w | 1.63 ± 0.07y-z | 5.31 ± 0.28u-ab | 3.45 ± 0.16t-w | |
| YLB044 | 5.87 ± 0.16k-t | 36.44 ± 1.80p-u | 27.18 ± 0.97y-ad | 2.12 ± 0.21w-y | 4.39 ± 0.15z-ab | 3.38 ± 0.18u-w | |
| YLB045 | 5.91 ± 0.10k-t | 51.69 ± 1.41i-s | 30.66 ± 1.82w-ad | 2.57 ± 0.14u-y | 6.45 ± 0.24s-x | 3.48 ± 0.03t-w | |
| YLB046 | 6.59 ± 0.19d-l | 67.93 ± 1.36g-o | 31.92 ± 2.30u-ad | 2.42 ± 0.21v-y | 6.09 ± 0.34t-y | 3.41 ± 0.17u-w | |
| YLB047 | 6.20 ± 0.65i-q | 48.86 ± 1.33k-u | 55.01 ± 2.34e-m | 4.43 ± 0.46l-p | 12.56 ± 1.47f-h | 8.25 ± 0.79h-j | |
| YLB048 | 5.79 ± 0.09l-u | 38.81 ± 1.18p-u | 22.26 ± 1.11ac-ad | 2.58 ± 0.10u-y | 5.16 ± 0.31v-ab | 4.42 ± 0.22p-u | |
| YLB049 | 6.07 ± 0.09j-s | 44.10 ± 1.08m-u | 44.38 ± 1.72j-w | 2.21 ± 0.13w-y | 7.89 ± 0.17o-s | 4.77 ± 0.07o-u | |
| YLB050 | 5.93 ± 0.20k-t | 34.13 ± 2.26p-u | 45.85 ± 1.39i-v | 2.21 ± 0.11w-y | 8.79 ± 0.64k-o | 4.69 ± 0.30o-u | |
| YLB051 | 5.14 ± 0.22t-z | 44.86 ± 2.87l-u | 42.31 ± 0.99l-x | 0.62 ± 0.07aa | 4.52 ± 0.06y-ab | 2.56 ± 0.17w-y | |
| YLB052 | 3.84 ± 0.29ac-ad | 35.04 ± 3.08p-u | 35.31 ± 0.42q-ad | 1.12 ± 0.04z-aa | 5.23 ± 0.45v-ab | 3.03 ± 0.26v-x | |
| YLB053 | 4.64 ± 0.83w-ac | 98.56 ± 14.59e-f | 53.47 ± 7.96e-n | 3.30 ± 0.57s-v | 9.39 ± 1.07k-m | 5.14 ± 0.89n-s | |
| YLB054 | 3.59 ± 0.44ad-ae | 122.31 ± 15.72d | 49.79 ± 4.31h-r | 2.24 ± 0.25w-y | 6.93 ± 0.46q-u | 4.54 ± 0.78p-u | |
| YLB055 | 4.51 ± 0.53x-ac | 29.82 ± 3.93r-u | 50.40 ± 6.38h-q | 3.43 ± 0.32q-u | 11.56 ± 1.17h-j | 5.69 ± 0.74m-q | |
| YLB056 | 5.88 ± 0.29k-t | 71.88 ± 1.96g-l | 56.21 ± 2.40d-l | 2.17 ± 0.18w-y | 8.31 ± 0.50k-r | 4.84 ± 0.11o-t | |
| YLB057 | 5.14 ± 0.23t-z | 23.27 ± 0.66t-u | 23.60 ± 1.88ab-ad | 3.39 ± 0.02r-v | 4.82 ± 0.21x-ab | 4.59 ± 0.04p-u | |
| YLB058 | 5.51 ± 0.92n-w | 37.71 ± 3.24p-u | 28.30 ± 3.28x-ad | 2.98 ± 0.35s-w | 6.37 ± 1.09s-x | 4.63 ± 0.59o-u | |
| YLB059 | 4.83 ± 0.48v-ab | 32.68 ± 2.29q-u | 33.84 ± 1.28t-ad | 2.65 ± 0.22t-x | 3.96 ± 0.42aa-ab | 4.08 ± 0.08r-v | |
| YLB060 | 7.13 ± 0.62c-h | 72.58 ± 6.82g-k | 37.76 ± 4.05o-ab | 3.06 ± 0.47s-w | 10.26 ± 1.19i-k | 4.57 ± 0.78p-u | |
| YLB061 | 6.38 ± 0.42g-n | 56.84 ± 2.90h-r | 36.46 ± 3.36o-ad | 3.01 ± 0.04s-w | 9.20 ± 0.84k-m | 3.81 ± 0.29s-w | |
| YLB062 | 6.45 ± 0.63f-m | 504.56 ± 69.22b | 49.16 ± 4.02h-s | 5.30 ± 0.85i-m | 14.28 ± 1.76d-f | 6.67 ± 0.48k-m | |
| YLB063 | 6.30 ± 0.35g-o | 51.41 ± 3.35i-s | 51.04 ± 6.08f-o | 2.83 ± 0.33t-x | 10.33 ± 0.83i-k | 4.76 ± 0.60o-u | |
| YLB064 | 6.18 ± 0.35i-q | 50.60 ± 3.07j-t | 26.34 ± 3.19z-ad | 1.98 ± 0.07x-y | 6.39 ± 0.76s-x | 3.59 ± 0.45t-w | |
| Sinseondu | 2.98 ± 0.05ae | 26.41 ± 2.85s-u | 35.82 ± 2.60p-ad | 2.09 ± 0.06w-y | 5.47 ± 0.17u-aa | 2.83 ± 0.05v-y | |
| Total mean | 5.81 | 78.19 | 48.36 | 4.49 | 10.50 | 6.14 | |
| CV (%) | 22.28 | 158.60 | 34.49 | 56.17 | 46.28 | 51.93 | |
Antioxidant activities
Due to the different mechanisms of action, a single colorimetric assay might not fully provide insight into the overall antioxidant capacity of plant polyphenols (Amarowicz and Pegg, 2008; Nassourou et al., 2016). In this study, the antioxidant activity of the entire accession was determined using three independent assays including the DPPH• scavenging activity (0.62-11.68 ㎎ AAE/g), ABTS•+ scavenging activity (3.70-22.88 ㎎ TE/g), and reducing power (1.61- 15.01 ㎎ AAE/g). Each of the antioxidant activities displayed significant variation (p < 0.05) with more than a six-fold difference (Table 3). These ranges once again signify a wide diversity among the yardlong bean accessions (Choi et al., 2024a; Gerrano et al., 2022; Morshedloo et al., 2022). Previous studies have also shown the antioxidant activities of V. unguiculata subspecies although there are variations in extraction protocols, analysis conditions, and reporting methods (Moloto et al., 2020; Tungmunnithum et al., 2021). Compared to the control cultivar, only four accessions, including YLB051, YLB052, YLB043, and YLB064, had a lower DPPH• scavenging activity, with the first two showing a significantly lower level (p < 0.05). Likewise, accession YLB030 had a significantly lower ABTS•+ scavenging activity than Sinseondu (p < 0.05). Although accessions YLB028, YLB030, YLB027, YLB051, YLB006, and YLB026 had a lower reducing power than the control, the difference was not statistically significant (Table 3). Interestingly, accessions with a higher polyphenol content exhibited a greater antioxidant activity. These observations support the role of yardlong bean polyphenols in combating reactive radicals (Amarowicz and Pegg, 2008; Lee et al., 2021). Notably, accessions YLB038, YLB029, YLB001, YLB033, and YLB002, simultaneously exhibited higher DPPH• scavenging activity, ABTS•+ scavenging activity, and reducing power values (Table 1). It is worth noting that accession YLB029 also had a good lipid quality as described before. Overall, these accessions could be good sources of antioxidants (Abebe and Alemayehu, 2022; Traber et al., 2019).
Cluster, principal component, and correlation analyses
Multivariate analysis techniques were employed to further investigate the distribution of the yardlong bean accessions and their connection to the analyzed parameters (Padhi et al., 2022; Tungmunnithum et al., 2021). The entire dataset obtained from the biochemical analysis was standardized and then analyzed through cluster analysis, principal component analysis, and correlation analysis (Fig. 2). The cluster analysis divided the accessions into seven groups. Notably, the control cultivar (cluster V) and accession YLB002 (cluster III) were separate which could be attributed to their characteristic features related to vitamin C content, lipid quality, and antioxidant activities (Fig. 2a, Table 4). The largest number of accessions were grouped in cluster VI (n = 21) followed by cluster IV (n = 19). Clusters I, II, and VII contained thirteen, four, and six accessions, respectively. Accessions in cluster IV had the highest average vitamin C content, which was significantly different from the other clusters (Table 4). Cluster II contained accessions with the highest average levels of linoleic acid, PUFA, total phenol, total saponin, and antioxidant activities, each differing significantly from the other clusters. In contrast, accessions in Cluster IV had the lowest levels of total phenol, total tannin, total saponin, and all the antioxidant activities. Overall, the clustering analysis grouped the accessions based on their distinctive biochemical features (Table 4). This finding aligned with the PCA results, where the accessions were grouped based on their cluster number (Fig. 2b, Fig. 2c). Parameters such as oleic acid, linoleic acid, total phenol, total saponin, and antioxidant activities were the major contributors to the variance observed along PC1 which explained 35.66% of the total variance. Additionally, palmitic acid, stearic acid, and linoleic acid, along with total fatty acids, were the primary contributors to PC2 which accounted for 28.30% of the total variance (Table 4). The loading plot further revealed the clustering of biochemically related parameters, such as polyphenols and antioxidant activities (Fig. 2c). It also showed that unsaturated fatty acids, with contrasting levels, were positioned on opposite sides of the principal components. These findings were further confirmed by Pearson’s correlation analysis (Appendix 2). All antioxidant activities displayed a strong and significant correlation with total polyphenol content (r ≥ 0.60, p < 0.0001). This observation corroborates previous findings confirming the roles of polyphenols as reactive radical scavengers (Amarowicz and Pegg, 2008; Carvalho et al., 2021; Lee et al., 2021; Lee et al., 2024; Tungmunnithum et al., 2021). The strong correlation of linoleic acid with antioxidant activities (r ≥ 0.42, p ≤ 0.001) was also supported by previous findings (Amarowicz and Pegg, 2008). The weak correlation of vitamin C with most of the parameters suggests the differences in the biosynthetic pathways between the studied metabolites. Additionally, LA showed a strong and negative correlation with OA (r = -0.76, p < 0.0001) and LLA (r = -0.38, p = 0.001). Such inverse relationships could be explained by the interconversion of unsaturated fatty acids through the actions of fatty acid desaturase enzymes (Torres-Franklin et al., 2009).
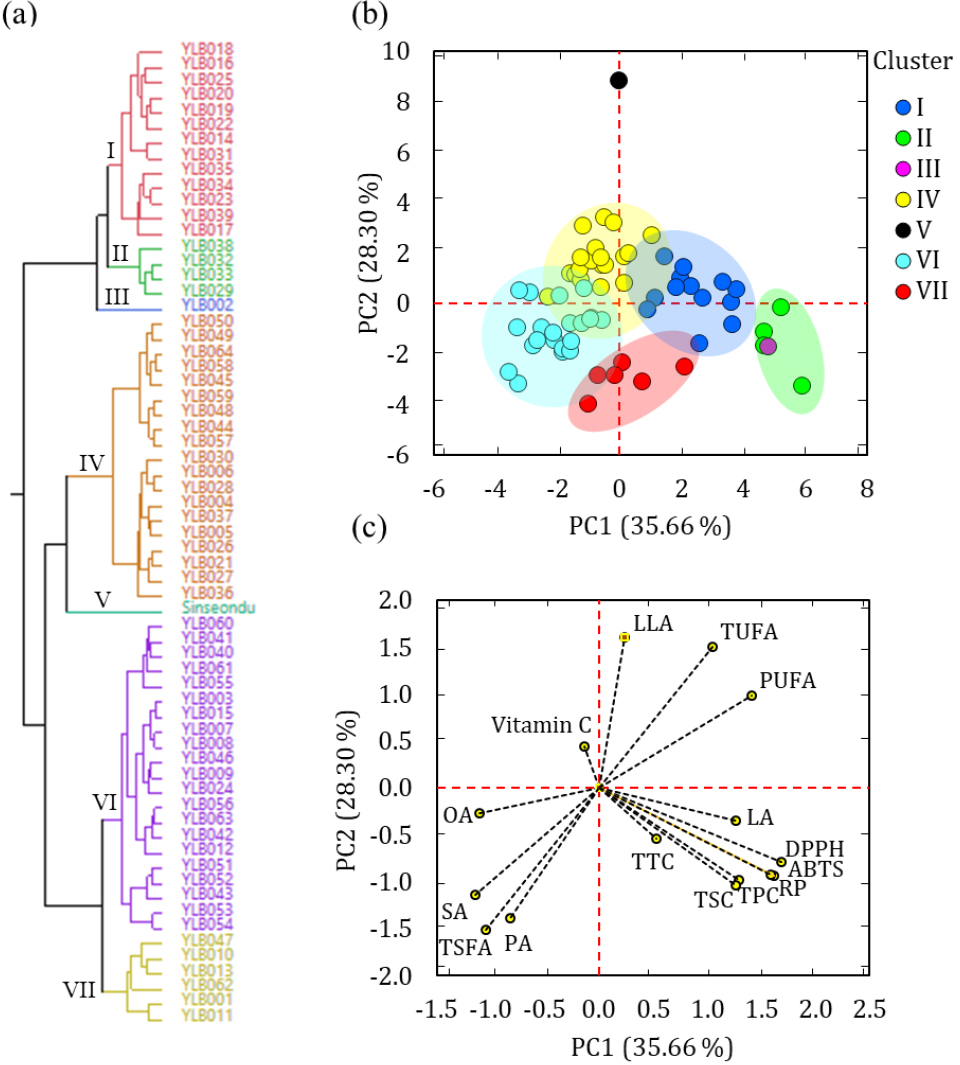
Fig. 2.
Dendrogram showing cluster analysis (a), and score plot of accessions (b) and loading plot of variables(c) from the principal component analysis. ABTS: ABTS•+ scavenging activity, DPPH: DPPH• scavenging activity, LA: Linoleic acid, LLA: Linolenic acid, OA: Oleic acid, PA: Palmitic acid, PUAF: Total polyunsaturated fatty acid, RP: Reducing power, SA: Stearic acid, TSFA: Total saturated fatty acid, TUFA: Total unsaturated fatty acid, TPC: Total phenolic content, TSC: Total saponin content, TTC: Total tannin content.
Table 4.
Variations of biochemical parameters among the different yardlong bean clusters.
| Parameter | Clusters | YLB002 | Sinseondu | PCAq contribution | |||||
| I | II | IV | VI | VII | PC1 (%) | PC2 (%) | |||
| Vitamin C (㎎/g) | 2.19 ± 0.92bp | 1.86 ± 0.18bc | 3.03 ± 0.66a | 2.05 ± 0.48bc | 1.43 ± 0.52c | 2.82 ± 0.06 | 0.31 ± 0.01 | 0.08 | 1.22 |
| Palmitic acid (%) | 28.62 ± 0.63c | 28.57 ± 0.86c | 29.34 ± 0.68bc | 30.19 ± 0.99ab | 30.87 ± 1.14a | 28.78 ± 0.05 | 21.69 ± 0.07 | 3.29 | 11.66 |
| Stearic acid (%) | 2.95 ± 0.37b | 3.17 ± 0.12b | 3.15 ± 0.40b | 3.99 ± 0.40a | 3.88 ± 0.38a | 3.09 ± 0.01 | 2.78 ± 0.01 | 6.40 | 7.88 |
| Oleic acid (%) | 8.14 ± 1.49b | 6.91 ± 0.56b | 8.38 ± 2.01b | 12.33 ± 1.52a | 10.99 ± 2.08a | 8.32 ± 0.11 | 18.04 ± 0.44 | 5.89 | 0.46 |
| Linoleic acid (%) | 41.32 ± 3.09a | 42.44 ± 1.80a | 38.27 ± 1.74b | 36.31 ± 1.83c | 37.03 ± 0.79c | 39.62 ± 0.08 | 24.66 ± 0.16 | 7.75 | 0.75 |
| Linolenic acid (%) | 18.96 ± 2.41b | 18.91 ± 2.07b | 20.86 ± 1.66a | 17.19 ± 1.58b | 17.24 ± 0.77b | 20.20 ± 0.02 | 32.83 ± 0.22 | 0.28 | 15.64 |
| TSFAr (%) | 31.57 ± 0.80c | 31.74 ± 0.81bc | 32.49 ± 0.66b | 34.17 ± 1.04a | 34.74 ± 1.24a | 31.86 ± 0.04 | 24.47 ± 0.07 | 5.36 | 13.86 |
| TUFAs (%) | 68.43 ± 0.80a | 68.26 ± 0.81ab | 67.51 ± 0.66b | 65.83 ± 1.04c | 65.26 ± 1.24c | 68.14 ± 0.04 | 75.53 ± 0.07 | 5.36 | 13.86 |
| PUFAt (%) | 60.28 ± 1.35ab | 61.35 ± 0.64a | 59.12 ± 2.22b | 53.50 ± 1.68c | 54.27 ± 1.32c | 59.81 ± 0.07 | 57.49 ± 0.38 | 9.65 | 5.97 |
| TPCu (%) | 6.37 ± 0.92b | 8.61 ± 0.76a | 5.03 ± 0.81c | 5.45 ± 0.93c | 6.73 ± 0.35b | 7.06 ± 0.25 | 2.98 ± 0.05 | 8.09 | 5.94 |
| TTCv (㎎ CE/g) | 57.39 ± 16.19b | 91.65 ± 8.25ab | 42.56 ± 14.28b | 58.77 ± 20.87b | 159.86 ± 161.56a | 941.49 ± 41.97 | 26.41 ± 2.85 | 1.37 | 1.81 |
| TSCw (㎎ DE/g) | 61.04 ± 12.02b | 82.30 ± 10.24a | 32.73 ± 8.08d | 44.51 ± 7.43c | 61.44 ± 8.44b | 59.64 ± 4.37 | 35.82 ± 2.60 | 7.75 | 6.54 |
| DPPHx (㎎ AAE/g) | 6.22 ± 1.29b | 9.87 ± 1.26a | 2.80 ± 0.67c | 3.13 ± 1.22c | 6.50 ± 1.72b | 11.48 ± 0.51 | 2.09 ± 0.06 | 13.75 | 3.80 |
| ABTSy (㎎ TE/g) | 13.88 ± 1.85b | 21.58 ± 0.88a | 6.53 ± 1.65d | 8.33 ± 1.94c | 14.94 ± 2.77b | 21.91 ± 1.07 | 5.47 ± 0.17 | 12.68 | 5.38 |
| RPz (㎎ AAE/g) | 8.35 ± 1.61b | 13.29 ± 1.27a | 3.79 ± 1.25c | 4.51 ± 1.11c | 9.31 ± 2.19b | 12.26 ± 0.71 | 2.83 ± 0.05 | 12.29 | 5.23 |
Different superscript small letters (a-d) in a row indicate significantly different mean values at p < 0.05.
zRP: Reducing power, yABTS: ABTS•+ scavenging activity, xDPPH: DPPH• scavenging activity, wTSC: Total saponin content, vTTC: Total tannin content, uTPC: Total phenolic content, tPUAF: Total polyunsaturated fatty acid, sTUFA: Total unsaturated fatty acid, rTSFA: Total saturated fatty acid, qPrincipal component analysis.
To conclude, there is a global demand for sustainable food production to address food security and malnutrition. To achieve these goals, the exploitation of underutilized crops, such as yardlong beans, is becoming essential. This study showed the diversity of 64 yardlong bean accessions recently cultivated in Korea. The results also revealed significant variations in key biochemical factors, such as vitamin C content, fatty acid composition, lipid quality, total metabolites, and antioxidant activity, highlighting the nutritional and functional potential of yardlong beans. Accordingly, the top-performing accessions identified in this study could be utilized in food industries and breeding programs. Moreover, the diversity observed among the yardlong bean accessions could serve as a basis for future metabolomic and genomic studies. This study also highlights the importance of further exploring and conserving underutilized legumes, as they could play a vital role in global food systems.
