

Introduction
Materials and Methods
Safflower cultivation methods by experimental group
Statistical Analysis
Results and Discussion
Influence of photoperiod treatment on flowering and growth characteristics in safflower
Effects of controlled temperature on flowering acceleration and seed yield in safflower
Enhancing growth and seed yield in safflower through nutrient solution treatment
Correlation analysis results
Introduction
Safflower (Carthmus tinctorius L.), an annual herbaceous plant belonging to the Asteraceae family, has a long history as a medicinal plant in Korea, China, and Japan. Since the 20th century, it has been widely cultivated as a source of oilseed and red dye in various countries, including the United States and India (Choi et al., 2024; Park, 1998). Safflower is a long-day plant that flowers earlier under high-temperature and long-day conditions. Under short-day conditions, however, the vegetative growth period is extended and flowering is delayed (Excellent Medicinal Herb Management Guide). The plant is also known for its resistance to drought, heat, cold, and salinity (Emongor et al., 2017).
Safflower, known for its extensive pharmacological effects, is used to treat menstrual pain, joint pain, and other ailments. It is also widely applied for coronary artery dilation, improvement of myocardial ischemia, and immune system regulation. Previous studies reported several biological activities of the plant including anticoagulant and antithrombotic effects, as well as antioxidant, anti-aging, and anti-inflammatory properties (Delshad et al., 2018; Lou et al., 2017; Zhou et al., 2014). In particular, safflower seed extracts were found to promote Ca2+ absorption in osteoblasts (Jang et al., 2007), lower plasma cholesterol levels (Moon et al., 2001), and have been shown to enhance skin whitening and reduce wrinkles (Yeom et al., 2022).
Despite its diverse benefits, domestic safflower production in Korea is currently very low, leading to high dependence on imports. According to 2024 data from the Ministry of Food and Drug Safety, Korea imported a total of 341 M/T (Metric Ton) of safflower, with 90.49% (308.5 M/T) sourced from India and 9.52% (32.5 M/T) from China. Safety concerns have been raised due to the detection of heavy metals such as lead and arsenic in imported safflower (Oh et al., 2020). In stark contrast, data from Statistics Korea indicate that the annual domestic safflower production between 2018 and 2022 was only 32.15 M/T, accounting for just 0.05% of the total medicinal crop production (58,901.8 M/T) during the same period (KOSIS, Korean Statistical Information Service, 2023). To replace the annual import volume of 341 M/T, domestic production would need to increase approximately 10.6 times its current level. Given such low productivity, reducing reliance on imports and increasing domestic production are of utmost importance. Although safflower is a versatile crop, its domestic production remains insufficient due to the cultivation of traditional landraces that are highly susceptible to anthracnose and have low productivity. To address these issues, previous studies have explored the development of high-yield and disease-resistant safflower varieties (Choi et al., 2003; Oh et al., 2020). However, despite these efforts, domestic production has yet to reach a satisfactory level. Therefore, this study aims to determine the optimal cultivation conditions including photoperiod, temperature, and nutrient solution treatments to shorten the cultivation period of safflower, improve breeding efficiency, and fundamentally enhance domestic safflower productivity.
Materials and Methods
Safflower cultivation methods by experimental group
The safflower resources used in this study were provided by the National Agrobiodiversity Center (NAC), RDA, Jeonju-Si, South Korea, and were sown in plastic pots with an outer diameter of 11.7 ㎝ and an inner diameter of 10.8 ㎝. The cultivation environments were divided into four main categories, and five Cheongsoo safflower plants were used for each group in the experiment. The control and Group A were sown on March 22, 2024, while Groups B and C were sown later on April 24, 2024, to accommodate the different environmental conditions required for the experiment. The control group was cultivated in a greenhouse environment similar to actual house cultivation with only water. Group A was grown in a room temperature environment with only water under two conditions: (ⅰ) a 15 h photoperiod and (ⅱ) an 18 h photoperiod. group B was cultivated under an environment set at 30°C with 35 ± 5% with only water under two conditions: (ⅰ) a 15 h photoperiod and (ⅱ) an 18 h photoperiod. group C was cultivated under the same environmental conditions as group B, but with added nutrient solution under two conditions: (ⅰ) a 15 h photoperiod and (ⅱ) an 18 h photoperiod. Photoperiod durations were regulated using LED lamps (W4, UV1, R2, FR1; 19m, 1170 ㎚; Ecoreafarm, Hanam-si Gyeonggi-do, Korea) installed in a chamber with dimensions of 144 ㎝ in width, 71 ㎝ in height, and 60.5 ㎝ in depth. This allowed for precise control of light conditions across all experimental groups.
The groups were evaluated for days to flowering (DTF), plant height (PH), leaf length (LL), leaf width (LW), number of branches (NB), and number of seeds (NS). The minimum, maximum, and average temperatures for the control group and Group A were measured at 9 a.m. and 2 p.m. under room temperature conditions and are presented in Table 1. These values provide a detailed representation of monthly temperature variations during the experimental period. For the nutrient solution, a commercially available product called Mulpure (Daeyu Chemical, Seoul, Korea) was used at a concentration of 2,000 ppm for watering (Table 2).
Table 1.
Measuring temperature (℃).
Table 2.
Nutrient solution ingredient (%).
| Ingredient (%) | N | K | CaCO3 | B | Fe | Zn | Mo | |
| SolutionⅠ | 5.5 | 4.5 | 2 | 0.00014 | 0.03 | 0.0001 | 0.0002 | |
| N | H3PO4 | K | Mg | Mn | B | Zn | Cu | |
| Solution Ⅱ | 2.5 | 2.2 | 5.3 | 1 | 0.007 | 0.005 | 0.003 | 0.0007 |
Statistical Analysis
All experiments were repeated five times, and the mean values and standard deviations were calculated. Statistical analysis for each repetition was performed using SAS software v9.5 (SAS Institute Inc., Cary, NC, USA), and the level of significance was tested at p < 0.05 using Duncan’s Multiple Range Test (DMRT). To visualize the correlations between the control group and each treatment group, heatmaps and biplots were generated using the online MetaboAnalyst 6.0 statistical analysis tool (www.metaboanalyst.ca).
Results and Discussion
Influence of photoperiod treatment on flowering and growth characteristics in safflower
The effects of photoperiod treatment conditions on the growth characteristics were statistically analyzed, and the results are presented in Fig. 1. The control group was cultivated under conditions similar to a greenhouse environment and exposed to a natural photoperiod. At the time of sowing, the natural daylight duration was approximately 12 h, gradually increasing to 14 h by the time of harvest. Growth characteristics were measured under these natural photoperiod changes and compared to groups with artificially set photoperiods, with the control group flowering after 71 days. However, group A, which was set to photoperiods of 15 h and 18 h, flowered in 46.6 days and 49 days, respectively, taking 22 to 24.4 days less than the control group. These results clearly demonstrate that photoperiod control effectively accelerates flowering by significantly reducing the time to flowering in safflower. In contrast, plant height, leaf length, and leaf width did not show significant variations between the control and group A, suggesting that photoperiod does not significantly impact these growth characteristics. Similarly, there was no significant difference in the number of branches between the groups (Fig. 1).
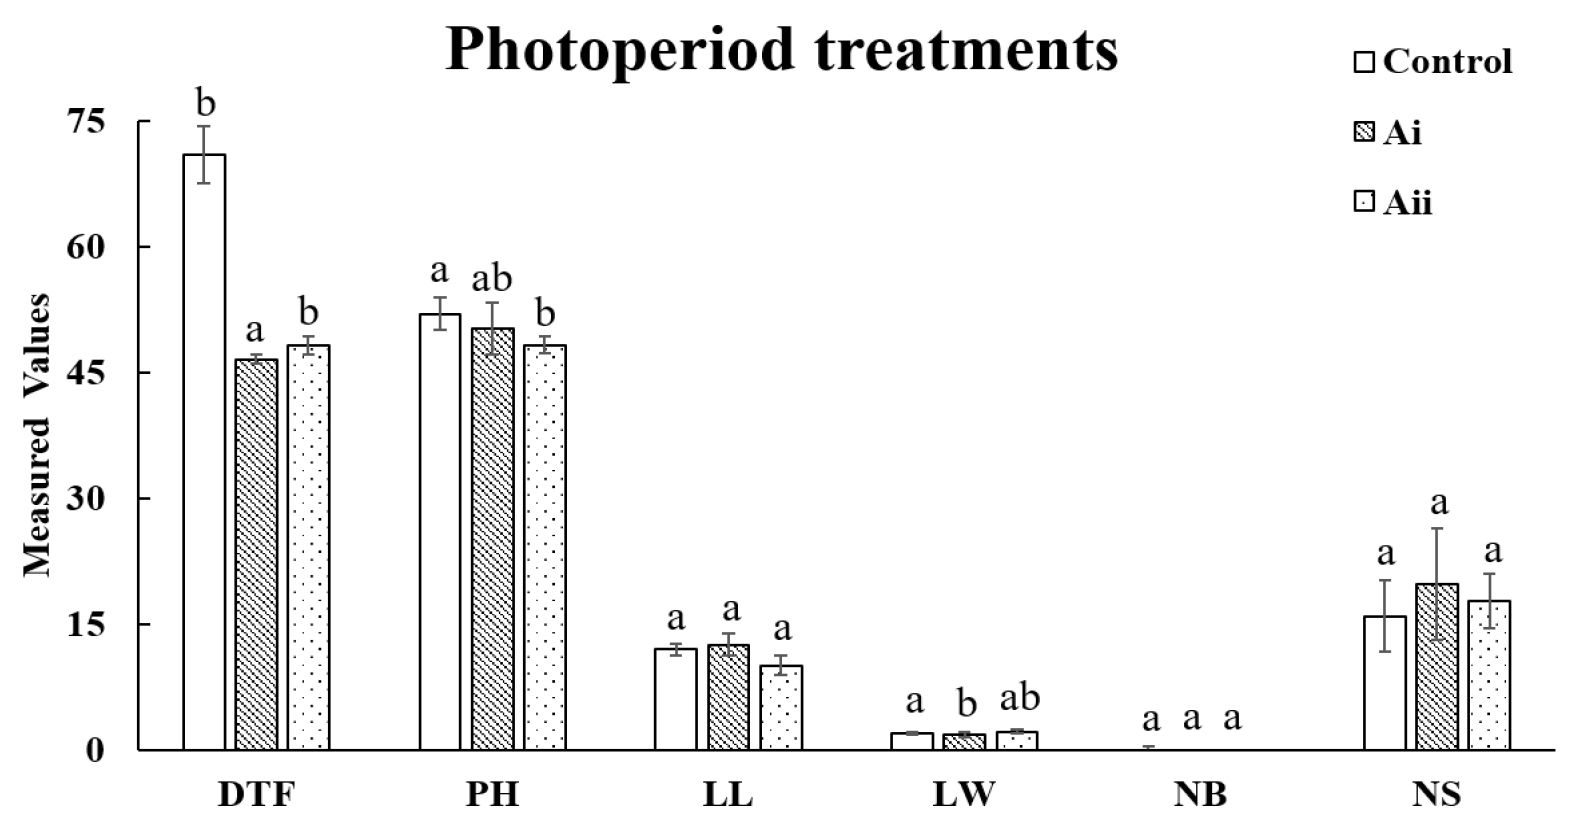
Fig. 1.
Comparison of Growth Characteristics Under Different Photoperiod Treatments. *All the values are means of five replicates ± standard deviation. Values with different letters vary significantly with DMRT (Duncan's Multiple Range Test) at 5% level (p < 0.05). DTF: Days to flowering (days), PH: Plant height (㎝), LL: leaf length (㎝), LW: leaf width (㎝), NB: Number of branches (ea) and NS: Number of seeds (ea).
This indicates that while photoperiod treatment is effective for accelerating flowering, its influence on vegetative growth traits appears to be minimal. According to Teixeira (2020), the transition to the flowering or dormancy stage is one of the main developmental processes in plants, and it is regulated primarily by light. Hyde and Setter (2022) reported that long photoperiod treatments significantly promote flowering in cassava crops. Additionally, in the Asteraceae family, long-day plants such as sunflowers (Helianthus annuus) have also shown shortened flowering times under controlled photoperiod treatments (Yañez et al., 2004). Similarly, safflower as a long-day plant, demonstrated a reduction in flowering time under photoperiod treatments in this study, further validating the role of photoperiod control as a powerful strategy for rapid generation advancement.
Effects of controlled temperature on flowering acceleration and seed yield in safflower
The effects of temperature treatment on the growth characteristics are presented in Fig. 2. Through this experiment, it was observed that group B, which was set with both photoperiod and a constant temperature, showed a shortened flowering time by approximately 4.2 to 8.8 days compared to group A, which was treated with photoperiod only. Group B, with a constant temperature, also showed higher values of plant height (PH), leaf length (LL), and leaf width (LW) compared to the other groups. Additionally, the number of branches increased under the conditions of group B. However, seed yield was found to be lower in group B compared to group A, suggesting that the earlier flowering induced by the 30°C constant temperature may have limited the time available for optimal seed development (Fig. 2). These results indicate that while high temperature accelerates flowering and promotes vegetative growth, it may also impose stress on reproductive development, particularly seed formation. According to De Storme and Geelen (2014), male reproductive development in plants is highly sensitive to environmental stress, which can lead to meiotic defects, early spore abortion, and male sterility. Similarly, in cucumbers (Cucumis sativa L.), high-temperature stress during the reproductive stage has been shown to cause sterility (Begcy et al., 2024). Furthermore, artificially induced high-temperature stress in Brassica napus resulted in reduced seed development and seed weight (Young et al., 2004). In this study, the high-temperature stress at 30°C likely acted as a heat stress condition, resulting in poor endosperm formation during seed development, as observed in previous studies (Zhuet al., 2021). This explains the reduced seed yield observed in group B. It should be noted that precise temperature control was not achieved in this experiment, which may have introduced variability in the results. Nonetheless, the findings underscore that temperature is a critical environmental factor influencing the reproductive schedule of safflower. While high temperature may negatively affect seed development, it is clear that it plays a significant role in accelerating flowering. Optimizing temperature conditions in future studies could maximize the benefits of earlier flowering while minimizing stress-related impacts on seed yield. These results highlight the potential of temperature management as a key strategy for achieving rapid generation advancement in safflower cultivation.
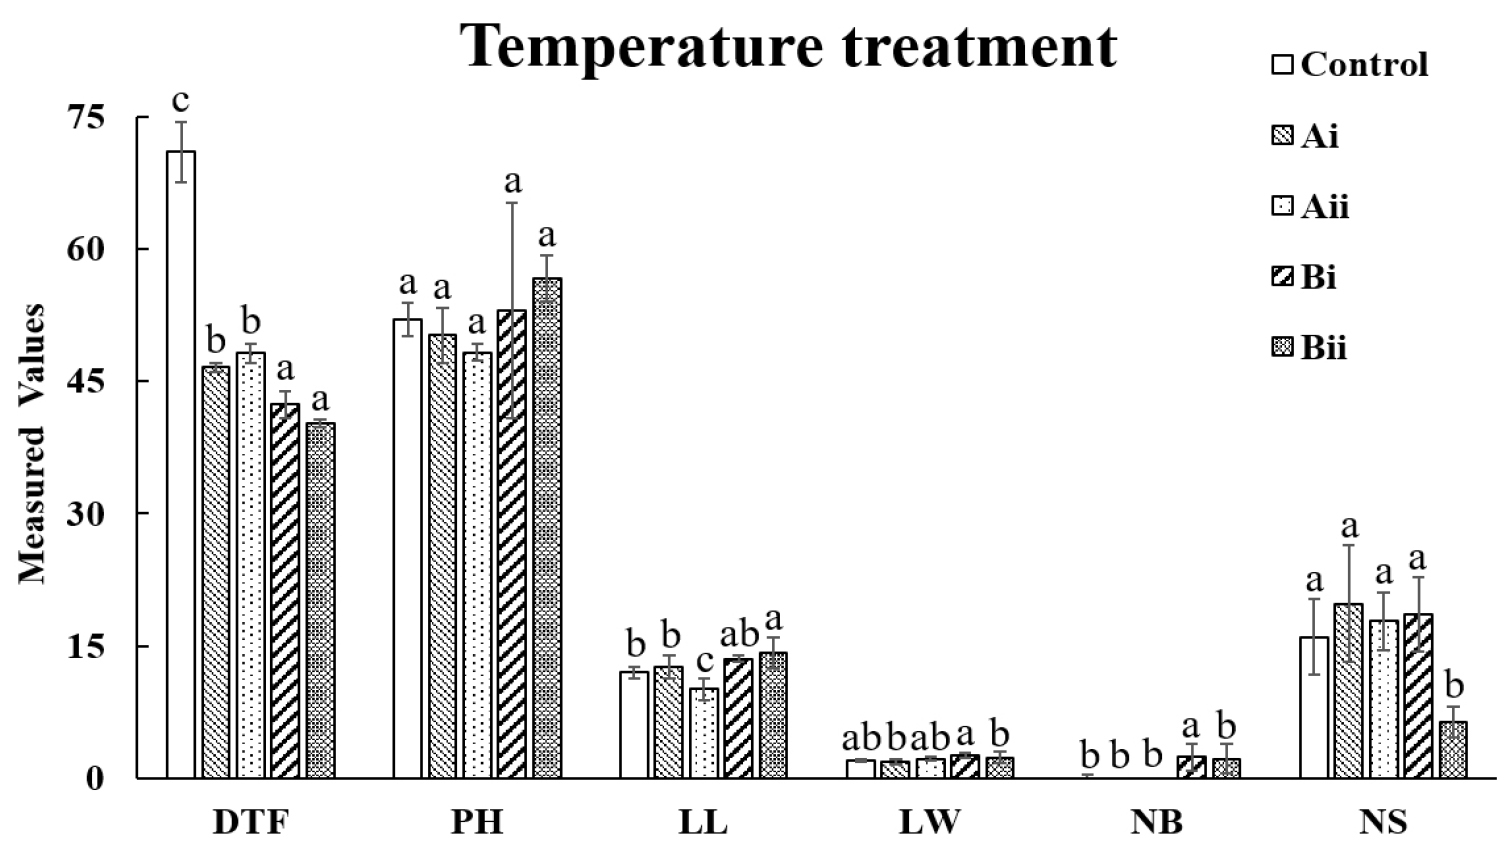
Fig. 2.
Comparison of Growth Characteristics Between Temperature-Treated and Other Groups. *All the values are means of five replicates ± standard deviation. Values with different letters vary significantly with DMRT (Duncan's Multiple Range Test) at 5% level (p < 0.05). DTF: Days to flowering (days), PH: Plant height (㎝), LL: leaf length (㎝), LW: leaf width (㎝), NB: Number of branches (ea) and NS: Number of seeds (ea).
Enhancing growth and seed yield in safflower through nutrient solution treatment
Fig. 3 shows the effect of nutrient solution treatment on growth characteristics. Using Table 3, a comparison was made between the control group and group Aⅰ, group Bⅰ, and group Cⅰ, which were selected based on high NS values (Fig. 3). The results showed that, compared to the control group, the flowering time in the Cⅰ condition was shortened by 29 days. Although there was no significant difference in flowering time compared to the Bⅰ condition, it was shortened by approximately 4.2 days. There was no significant difference in plant height, leaf length, and leaf width between the control group and the other groups. However, the higher number of branches and seeds observed in the group Cⅰ suggests that the nutrient solution treatment mitigated the negative effects of high-temperature stress observed in group B. These findings demonstrate that the addition of nutrient solution positively influenced reproductive development under stressful conditions. The addition of nutrient solution likely provided essential macro- and micronutrients that supported reproductive development and improved seed maturation under stressful conditions. These results align with previous studies, such as those by Liu et al., 2024; Sakamoto and Suzuki, 2020. which reported that nutrient solutions can alleviate abiotic stress and improve crop productivity. Similarly, the results of this study confirm that the Cⅰ condition, with the addition of nutrient solution, effectively mitigated the adverse effects of high-temperature stress observed in group B. This highlights that nutrient solution treatment not only alleviates stress but also accelerates flowering and improves seed yield, making it a valuable strategy for optimizing safflower cultivation under challenging environmental conditions.
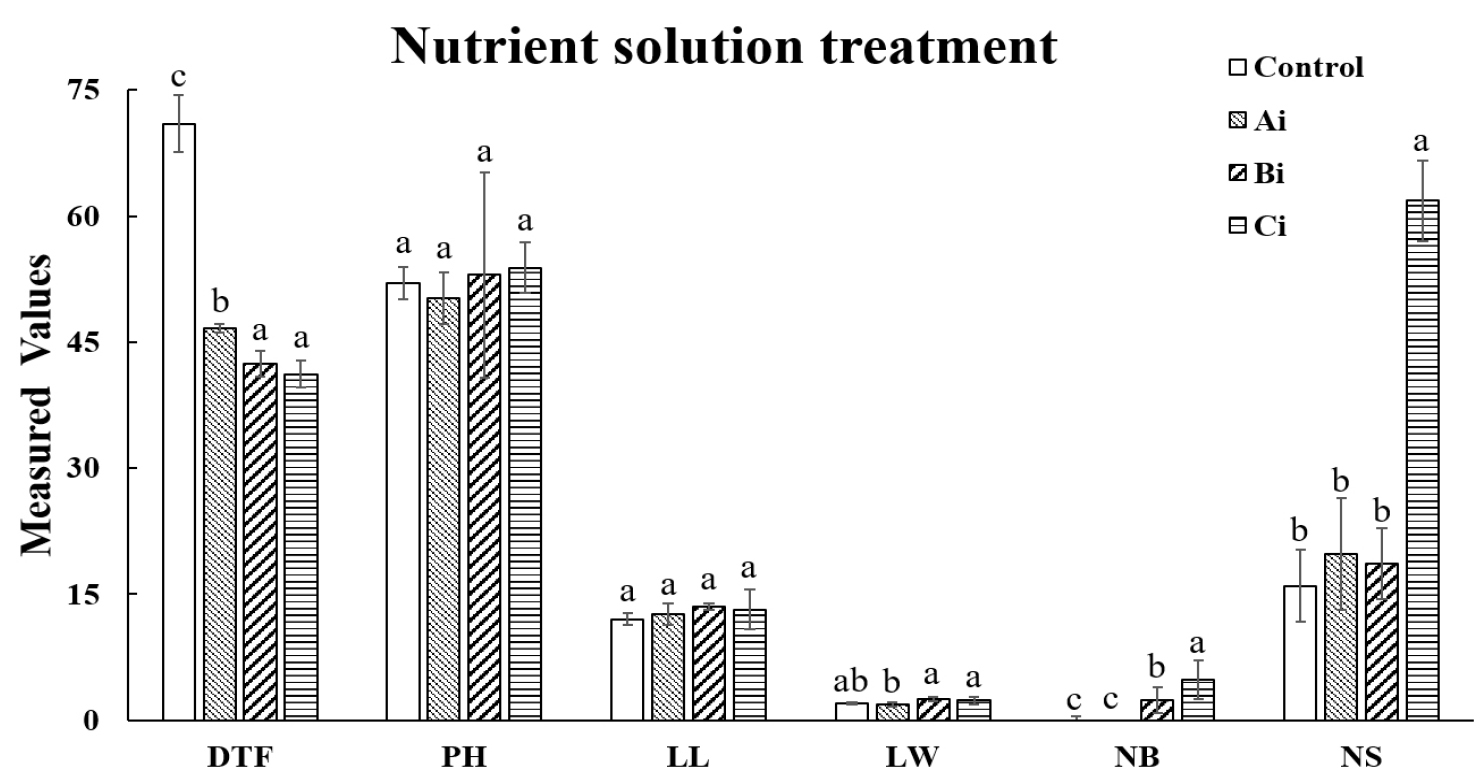
Fig. 3.
Effects of Nutrient Solution Addition on Growth Characteristics Across Groups. *All the values are means of five replicates ± standard deviation. Values with different letters vary significantly with DMRT (Duncan's Multiple Range Test) at 5% level (p < 0.05). DTF: Days to flowering (days), PH: Plant height (㎝), LL: leaf length (㎝), LW: leaf width (㎝), NB: Number of branches (ea) and NS: Number of seeds (ea).
Table 3.
Summary of growth characteristics across all treatment groups.
*All the values are means of five replicates ± standard deviation. Values with different letters vary significantly with DMRT (Duncan's Multiple Range Test) at 5% level (p < 0.05). Control: Cultivated in a greenhouse-like environment with natural conditions using only water.; Group A: Grown at room temperature with only water under two photoperiods (15 h, 18 h).; Group B: Exposed to a constant temperature of 30°C (35 ± 5% RH) with only water under two photoperiods (15 h, 18 h).; Group C: Cultivated under the same conditions as Group B (30°C, 35 ± 5% RH) but with the addition of nutrient solution under two photoperiods (15 h, 18 h).
Correlation analysis results
A correlation analysis was conducted to visualize how rapid generation advancement and growth characteristics change depending on the treatment groups. As shown in Fig. 4a, it was confirmed that the control group and group A, as well as group B and group C, formed large clusters together. 15A and 18A conditions were separated into subgroups, which is attributed to the decrease in DTF, although there were no significant differences in other growth characteristics. These findings indicate that photoperiod extension in the control group promotes generation advancement, but its influence on vegetative growth traits appears limited. Additionally, the similar correlation between the 15 h and 18 h photoperiods in groups B and C suggests that a photoperiod of 15 h is sufficient to achieve the desired effect of generation advancement. This suggests that longer photoperiods may not provide additional benefits beyond the 15 h condition.
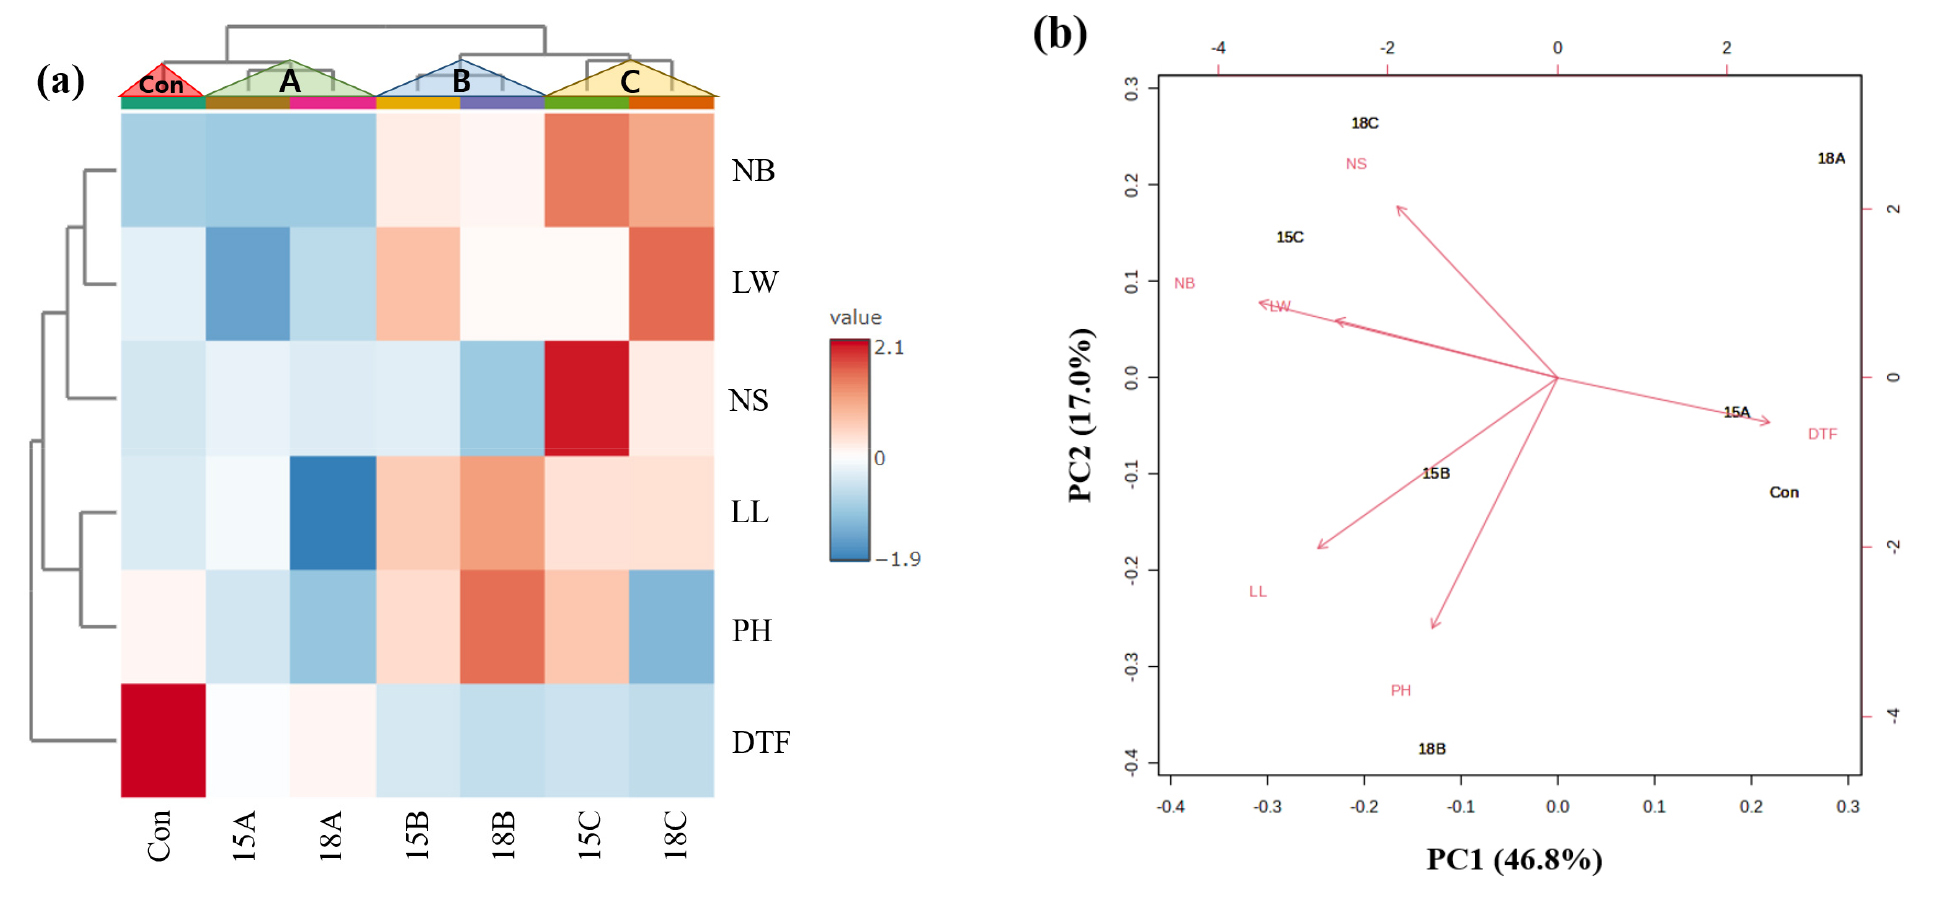
Fig. 4.
Heatmap and PCA showing the correlation between of the each treatment groups and the control. The red color indicates proportional correlation, while the blue color indicates inverse correlation. The plot illustrates how different variables contribute to the two-dimensional space, with the positioning of traits indicating their relationships. Variables that are positively correlated align in the same direction, while negatively correlated variables are oriented on opposite sides of the plot. The length and shading of the arrows correspond to the magnitude of each variable's contribution to the principal components. Con: Control, 15A: Aⅰ, 18A: Aⅱ, 15B: Bⅰ, 18B: Bⅱ, 15C: Cⅰ, 18C: Cⅱ.
In terms of growth characteristics (excluding DTF), groups B and C outperformed the other groups, which can be attributed to the shared condition of the same temperature in these groups, unlike the control and group A. In the case of group C, treated with nutrient solution, it was observed that NS was higher compared to group B, indicating that the addition of the nutrient solution has a positive effect on increasing NS. This highlights that nutrient solution treatment mitigates the negative effects of high-temperature stress and supports reproductive development, enhancing safflower productivity. In the PCA, the first principal component (PC1) accounted for 46.8%, and the second principal component (PC2) accounted for 17.0% (Fig. 4b). These results indicate a negative correlation between DTF and other growth characteristics. In contrast, there was a strong positive correlation between NB and LW, as well as between NB and NS. In the 15C condition, it is observed that DTF is shorter, and both NB and NS are higher. These findings suggest that the 15C condition is optimal for accelerating generation advancement and improving growth traits, combining the advantages of an appropriate photoperiod and nutrient supplementation.
Safflower is a long-day plant, which imposes certain limitations on its cultivation period and yield. In this study, it was confirmed that the combination of a 15-hour photoperiod, constant temperature, and nutrient solution treatment shortens the cultivation period and promotes superior growth characteristics in safflower. These findings are expected to contribute to the acceleration of safflower generation advancement and the improvement of productivity, leading to a positive impact on stable and efficient safflower production in domestic agriculture. Furthermore, since safflower seeds have various uses, future research will focus on determining the optimal harvesting time after flowering to achieve the highest seed germination rates.
