

Introduction
Materials and Methods
Plant materials and RNA isolation
Determination of total anthocyanin contents
Next generation sequencing and SNP analysis
Quantitative real-time polymerase chain reaction (qRT- PCR) validation from transcripts
DNA isolation and HRM analysis
Results and Discussion
DEG library sequencing to the reference transcriptome database
GO classification and the enrichment analysis of differentially expressed gene (DEG)
Expression of anthocyanin biosynthesis related gene and HRM analysis
Introduction
Most of flower buds in pear trees form on the 2-year-old twigs and then blooms and sets fruits in the following year. It takes much more time to evaluate seedling’s fruit traits compared to breeding of annual crops. The efficiency of pear breeding is low due to their long juvenility and large seedling size in the field. Self-incompatibility both within and between species makes pear trees genetically heterozygous (Westwood and Bjornstad, 1971). Therefore, it is necessary to develop early selection markers to screen seedlings with target traits to increase breeding efficiency. Molecular marker studies on major agricultural traits in pears, identification of AFLP markers linked to fruit skin color in Pyrus communis (Dondini et al., 2008), and the PyMADS18 gene putatively involved in anthocyanin biosynthesis in early fruit development of pear (Wu et al., 2013) and QTL for controlling the harvest time (Yamamoto et al., 2014) have been reported. Studies on the development of molecular markers related to scab resistance (Yang and Kruger, 1994), powdery mildew (Markussen et al., 1995) and color of fruit skin (Cheng et al., 1996) and color of flesh (Kim et al., 2019; Kim et al., 2021) have been reported in apple and peach. A study on the SNP molecular markers using the MdMYB1 gene has also been reported in apple (Zhu et al., 2011). Research on the development of molecular markers related to fruit traits is still ongoing, and this study plans to develop SNP markers, which are more widely used these days than the existing AFLP, SSR, and QTL.
The initial goals of pear breeding in National Institute of Horticultural and Herbal Science (NIHHS), Rural Development Administration (RDA), Korea were changed from fruit size and soluble solids content to soft thin fruit skin, red color skin, and high antioxidant content. New red-skinned pear varieties which are preferred by consumers, have recently been developed by Pear Research Center in NIHHS. It has been reported that anthocyanin, chlorophyll, and carotenoids are major pigments responsible for the coloring of fruit. Red skin of pear fruit is mainly due to the concentration and composition of anthocyanin (Steyn et al., 2005) and environmental factors including temperature (Zhang et al., 2016). In Asia, the most of pear cultivars descend from Pyrus pyrifolia has brown skin, but consumers demand pear fruit with various shapes and colors (Brewer and Palmer, 2011). In addition, the content of functional ingredients in pears is higher in skin than flesh, so red-skinned pear cultivars are beneficial to the intake of functional nutrients included within fruit skin. Most red-skinned pears are European pears (Pyrus communis L.) including ‘Rosired Bartlett’, ‘Canal Red’, and ‘Cascade’. Fruit of P. xingianginis Yu including ‘Wantianhong’, and ‘Meirensu’ in China have also red skin. Another example is ‘Daewon Hong’, a Japanese interspecific hybrid of an oriental pear and a European pear. These red-skinned pear cultivars are being used for cross breeding in order to develop new red pear cultivars in Pear Research Center in NIHHS. Although the anthocyanin content of some red- skinned pears is highest at early fruit development stage, the content showed a tendency to drop during fruit development and maturation (Steyn et al., 2004). Therefore, the underlying genetics of anthocyanin biosynthesis and the metabolic pathway still need further exploration. Expression of anthocyanin biosynthesis-related genes is regulated by MYB transcription factors (TF), basic helix-loop-helix (bHLH) TFs, and tryptophan-aspartic acid (WD)-repeat proteins complex (Baudry et al., 2004). R2R3 MYB transcription factor has been shown to control fruit flesh anthocyanin pigmentation (MYB10) and fruit skin color (MYB1) in apple (Ban et al., 2007; Espley et al., 2007). However, PcMYB10 does not appear to be the key transcription factor regulating the biosynthesis of anthocyanin and molecular marker in pear (Yang et al., 2013). This indicates that the red color trait is more complex in pear than in apple, and the regulatory molecular mechanism remains inconclusive. Because the sequences of genes related to the anthocyanin pathway between red- and green-skinned pears are no difference, it is difficult to develop SNP markers. Therefore, it is necessary to develop new markers that can distinguish between red- and green-skinned pears.
In this study reported here, the development of SNP markers for distinguishing between red- and green-skinned pear cultivars by HRM analysis offers the opportunity to use DNA markers for marker-assisted selection in breeding programs. These findings will help improve understanding of the genetic control of red skin color and provide gene resources for genetic improvement to breed new red skin pear cultivars.
Materials and Methods
Plant materials and RNA isolation
The plant materials used in this study were the red-skinned ‘Rosired Bartlett’ and green-skinned ‘Bartlett’ obtained from the National Institute of Horticultural and Herbal Science, Wanju, Republic of Korea. The samples were collected at 35, 49, 63, 77 days after full bloom (DAFB) and from 9, June through 19, August. The pear skin was peeled off and immediately frozen in liquid nitrogen, and stored at -80°C until use. Several pieces of freezed pear skin (3 g) were ground to powder in liquid nitrogen using a mortar and pestle. Total RNA extracted by procedure of modified Pine Trees Methods (Chang et al., 1993). The powdered tissues were extracted with a 15 mL of extraction buffer (2% CTAB, 2% PVP, 100 mM Tris-HCl pH 8.0, 25 mM EDTA, 2.0 M NaCl, 0.05% spermidine, 2% β-mercaptoethanol add just before use). The lysates were two times extracted with an equal volume of chloroform:isoamyl alcohol (24:1) and the phase separated by centrifugation at 15,000 rpm for 25 min. The aqueous phase was recovered and RNA was precipitated by the addition of 25% volume of 10 M LiCl and stored at 4°C for overnight. The precipitated RNA was collected by centrifugation at 15,000 rpm for 30 min. The pellet was dissolved in 500 μL of SSTE and equal volume of chloroform:isoamyl alcohol (24:1) was added. The phase was separated by centrifugation at 15,000 rpm for 30 min. Total RNA was precipitated with 2 volumes of ethanol at -80°C for 40 min, centrifuged and dissolved in diethylpyrocarbonate-treated water.
Determination of total anthocyanin contents
The total anthocyanin contents of the samples were measured using a modified method (Lee et al., 2024). Anthocyanin extraction of the powdered samples was done using 5 g of pear fruit skins in 50 mL of extraction buffer (methanol containing 15% 0.1N HCl) for 24 h at 4°C in darkness. Then 1 mL methanol were added to 5 mL sample and filtered. After filtration, absorbance of the sample was recorded at 520 nm (A520) using a spectrophotometer (UV-2501PC, Shimadzu, Kyoto, Japan). All samples were measured as triplicates in three independent biological replicates.
Next generation sequencing and SNP analysis
For mRNA isolation, RNA sample were prepared using the PolyA Tract mRNA Isolation Kit (Promega, USA) according to the manufacturer’s protocol. The cDNA libraries were used for emulsion polymerase chain reaction, as described by the manufacturer. The quality of cDNA was assessed using an Agilent 2100 BioAnalyzer (Agilent Technologies, CA, USA) and pyrosequencing was performed on a Roche 454 GS-FLX sequencer (Basel, Switzerland) by high throughput sequencing method (Margulies et al., 2005). Raw reads were filtered to exclude low complexity reads and reads containing adaptor sequences. The resulting clean reads were used as input for de novo transcript assembly by Roche GS FLX software 2.6 version with default parameters. The assembled transcripts were loaded on Blast2GO (http://www.blast2go.com) for functional annotation and gene ontology (GO) classification.
The reference genome and annotation information were downloaded from the NCBI Pyrus bretschneideri genome, and 161 polymorphism SNPs were searched between the two samples using 454 RNA-seq data of ‘Bartlett’ and ‘Rosired Bartlett’. SNP search and consensus sequence of ‘Bartlett’ and ‘Rosired Bartlett’ were extracted through read mapping using Tophat program. The SNP matrix was constructed to select polymorphism SNPs from ‘Bartlett’ and ‘Rosired Bartlett’ through SNP variation and then divided into homozygous SNPs and heterozygous SNPs. Primer design was performed using functional annotation and Primer3 program using DAVID program. SNP selection conditions were set to read depth 3 or higher. To select SNPs suitable for HRM from 161 polymorphic SNPs, primers were designed targeting the SNP positions using reference sequences. In addition to SNP positions, heterozygous types and mismatches were also considered for filtering. Finally, 21 SNPs were selected, the product size was 80-150 bp, the melting temperature was 55-65°C, and the primer size was 20-24 bp.
Quantitative real-time polymerase chain reaction (qRT- PCR) validation from transcripts
RNA sample was reverse-transcribed using random hexamers and Superscript Ⅲ First Strand Synthesis Systems for RT- PCR Systems (Invitrogen, Life Technologies, CA). The gene expression was examined using the SYBR Premix EX Taq Kit (Takara, Tokyo, Japan) on an Applied Biosystems 7500 Fast Real-Time PCR System, according to the manufacturer’s protocol. PCR amplification was performed with an initial denaturation step at 95°C for 10 min, followed by 40 cycles of 95°C for 5 sec, 60°C for 1 min, 72°C for 30 sec and a final extension at 72°C for 3 min.
Gene specific primers were designed according to the reference (Yang et al., 2013). The 2-∆∆CT method (Livak and Schmittgen, 2001) was used to normalize and calibrate transcript values relative to the actin from Pyrus communis (accession number AF386514) as internal reference housekeeping genes. Each experiment was run in triplicate using three biological replicates.
DNA isolation and HRM analysis
Genomic DNA was extracted from leaf tissue of 6 red- skinned ‘Rosired Bartlett’, ‘Califonia’, ‘Canal Red’, ‘Sariquzal’, ‘Ooharabeni’, ‘Beniamin’ and 6 green-skinned ‘Bartlett’, ‘Luyun’, ‘Giant Sujeongbae’, ‘Chanxili’, ‘Chanxixueli’, ‘Kiyomaro’ using the DNeasy Plant Mini Kit following the manufacturer’s instructions (Qiagen, Valencia, CA, USA). DNA quality and concentrations were assessed by 1% (w/v) agarose gel electrophoresis and using a NanoDrop2000 spectrophotometer (Thermo-Scientific, Rockford, IL, USA). To detect SNP markers, PCR primers for high resolution melting (HRM) analysis were designed using Primer 3 (Rozen and Skaletsky, 2000). PCR amplifications were performed in a total volume of 20 μL on an Applied Biosystems 7500 Fast Real-Time PCR System, according to the manufacturer’s protocol (Wittwer et al., 2003). The reaction mixture contained 20 ng genomic DNA, 2 μL of 10× PCR buffer (ELPIS Bio, Korea), 1 μL of 10 mM dNTP mixture, 0.1 μL of rTaq PLUS polymerase (ELPIS Bio, Korea), 1 μL of LCGreen® Plus+ Melting Dye (BioFire Diagnostics, UT, USA) 0.25 μM of each primer. The PCR cycling procedure included a pre-denaturation step at 95°C for 10 min, followed by 40 cycles at 95°C for 10 sec, and 1 min at the target annealing temperature, followed by a final hold at 4°C. A melting cycle was performed by increasing the temperature by 0.2°C increase every 5 sec from 68 to 95°C. Melting data were analyzed using the Precision Melt Analysis Program (Bio-Rad, CA, USA).
Results and Discussion
DEG library sequencing to the reference transcriptome database
During four devezlopmental stages, 35, 49, 63, and 77 days after full bloom and fruit ripening, anthocyanin accumulation pattern of both ‘Rosired Bartlett’ and ‘Bartlett’ fruit were analyzed. The anthocyanin concentration highly increased at the 63 days after full bloom and then decreased (data not shown). In accordance with the pattern of anthocyanin accumulation during ripening, we used the samples of 63 days after full bloom of ‘Rosired Bartlett’ and ‘Bartlett’ for analyzation the NGS. Red-skinned ‘Rosired Bartlett’ did not show any distinct changes in red pigmentation from early stage to maturity, while green-skinned ‘Bartlett’ showed red color on its fruit skin in parts during the early stage and then the expression of red pigment decreased with maturation. Therefore, mature ‘Bartlett’ fruit olny showed green pigmentation. The total number of readings of ‘Rosired Bartlett’ using the Roche GS FLX454 is 398,520 and the total nucleotide sequence length is 160,838,851 bp, the average sequence length of the read is 404 bp. The coverage against transcripts is 3.72 × and 73.04% of the trimmed reads were mapped to the reference genome of GDR (https://www. rosaceae.org). The total number of readings of ‘Bartlett’ is 272,853 and the total nucleotide sequence length is 107,402,101bp, the average sequence length of the read is 394 bp. The coverage against transcripts is 2.51 × and 75.32% of the trimmed reads were mapped to the reference genome of GDR (https://www. rosaceae.org).
GO classification and the enrichment analysis of differentially expressed gene (DEG)
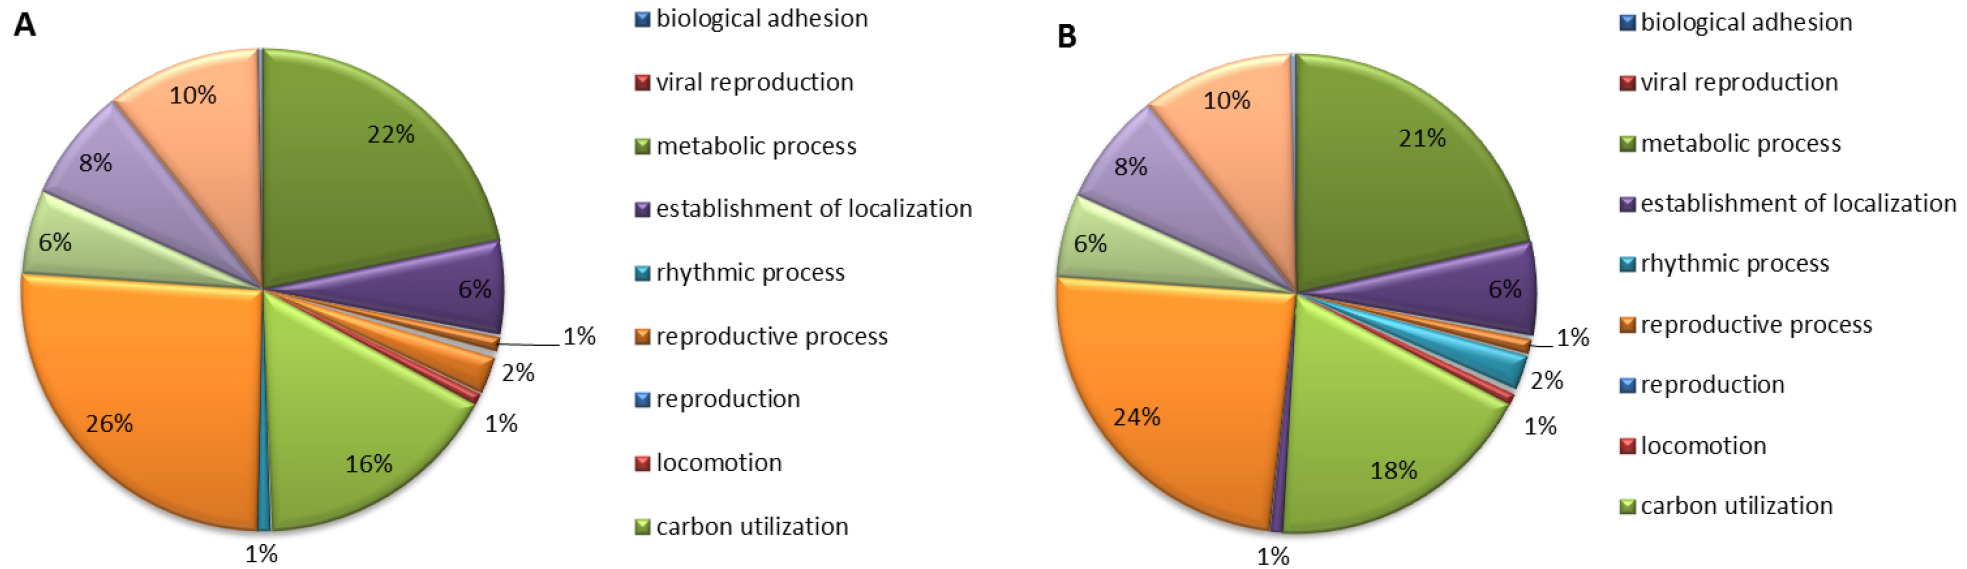
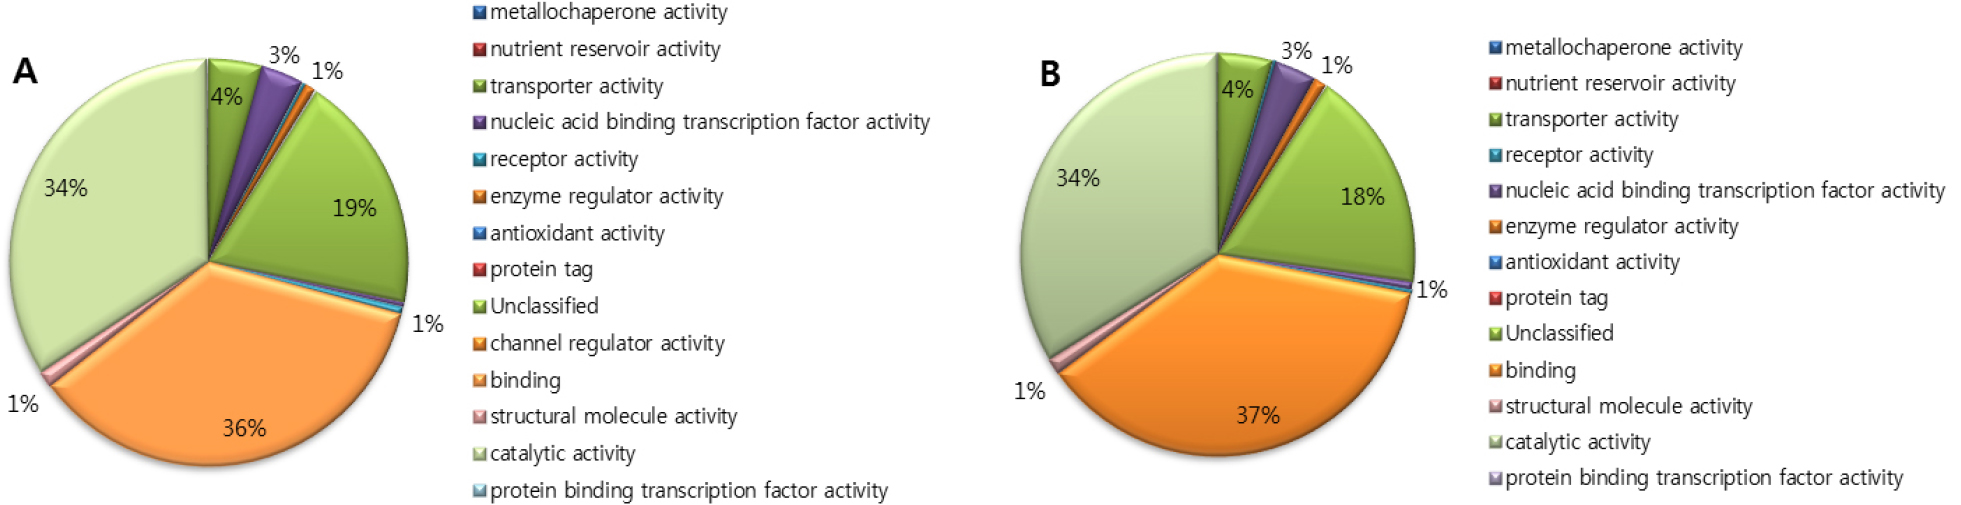
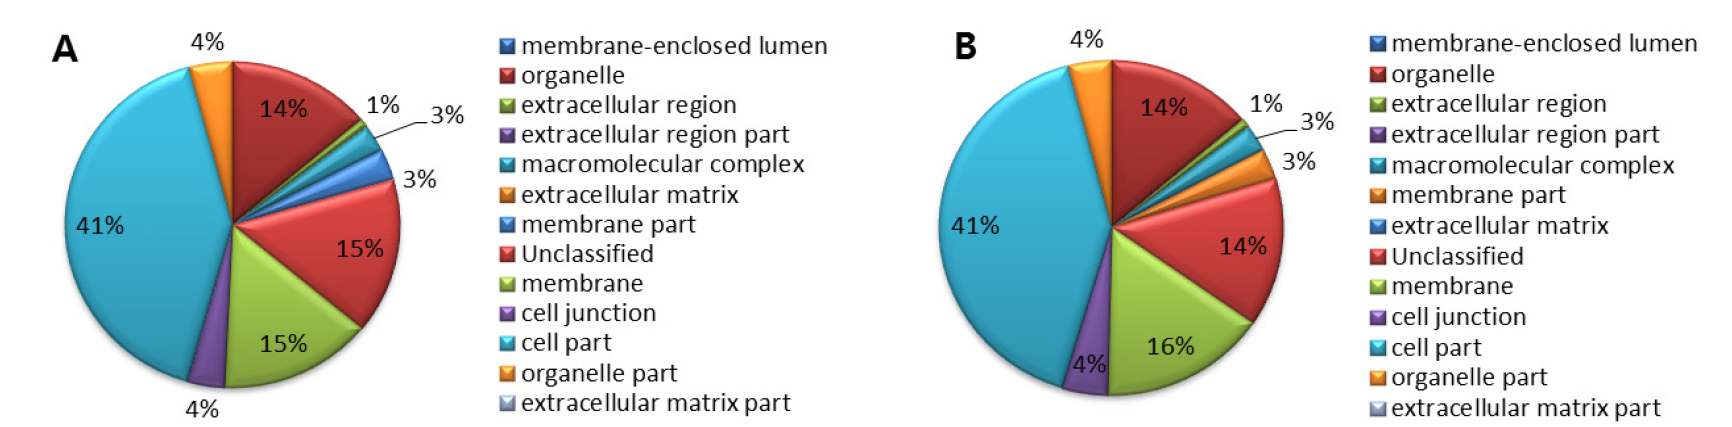
Gene ontology analysis of ‘Rosired Bartlett’ and ‘Bartlett’ was accomplished by classifying genes with function, biological processes, molecular function, and cellular component. Gene ontology analysis of ‘Rosired Bartlett’ and ‘Bartlett’, biological process involving various biological objectives accounted for 29%, molecular function involving gene products at the biochemical level accounted for 29%, cellular component involving the location of the gene product accounted for 23%, and transcriptomes which do not show homology with the reported gene accounted for 19%, respectively (data not shown). Gene ontology analysis of both ‘Rosired Bartlett’ and ‘Bartlett’, total read number and total nucleotide sequence length are different but functional gene group accounting is the same, because ‘Rosired Bartlett’ was bud mutation of ‘Bartlett’. Gene ontology analysis of ‘Rosired Bartlett’, in the biological process (Fig. 1) unclassified transcriptome occupied 26%, metabolic process 22%, response to stimulus 16%, biological regulation 10%, cellular process 8%, establishment of localization 6%, developmental process 6%. In the biological process of ‘Bartlett’, unclassified transcriptome occupied 24%, metabolic process 21%, response to stimulus 18%, biological regulation 10%, cellular process 8%, establishment of localization 6%, developmental process 6%, besides this there are various transcriptomes belonging to reproductive process or cellular component organization or biogenesis, a multi-organism process. Gene ontology analysis of ‘Rosired Bartlett’, in the molecular function involved in gene products at the biochemical level (Fig. 2) binding 36%, catalytic activity 34%, unclassified 19%, transporter activity 4%, nucleic acid binding transcription factor activity 3%, enzyme regulator activity 1%, and molecular transeducer activity 1%, respectively. Gene ontology analysis of ‘Bartlett’, in the molecular function, binding 37%, catalytic activity 34%, unclassified 18%, transporter activity 4%, nucleic acid binding transcription factor activity 3%, enzyme regulator activity 1%, and molecular transeducer activity 1%, respectively. Gene ontology analysis of ‘Rosired Bartlett’, in the cellular component which involved the location of the gene product (Fig. 3), cell part 41%, membrane 15%, unclassified 15%, organelle 14%, cell junction 4%, organelle part 4%, membrane part 3%, and macromolecular complex 3%, respectively. Gene ontology analysis of ‘Bartlett’, in the cellular component cell part 41%, membrane 16%, organelle 14%, unclassified 14%, cell junction 4%, organelle part 4%, membrane part 3%, and macromolecular complex 3%, respectively. ‘Rosired Bartlett’ and ‘Bartlett’ showed the same transcriptome distribution. Based on the results of NGS analysis, some transcripts of ‘Bartlett’ showed very low expression, whereas ‘Rosired Bartlett’ showed high expression levels and other transcripts of ‘Rosired Bartlett’ exhibited very low expression levels, whereas expression in Bartlett was high. In these transcriptomes, 80% of the genes were unknown genes, and 10% were predicted proteins. Therefore, it would be necessary to continue research on genes whose information is not known in a selection of genes showing differences in expression between cultivars.
Expression of anthocyanin biosynthesis related gene and HRM analysis
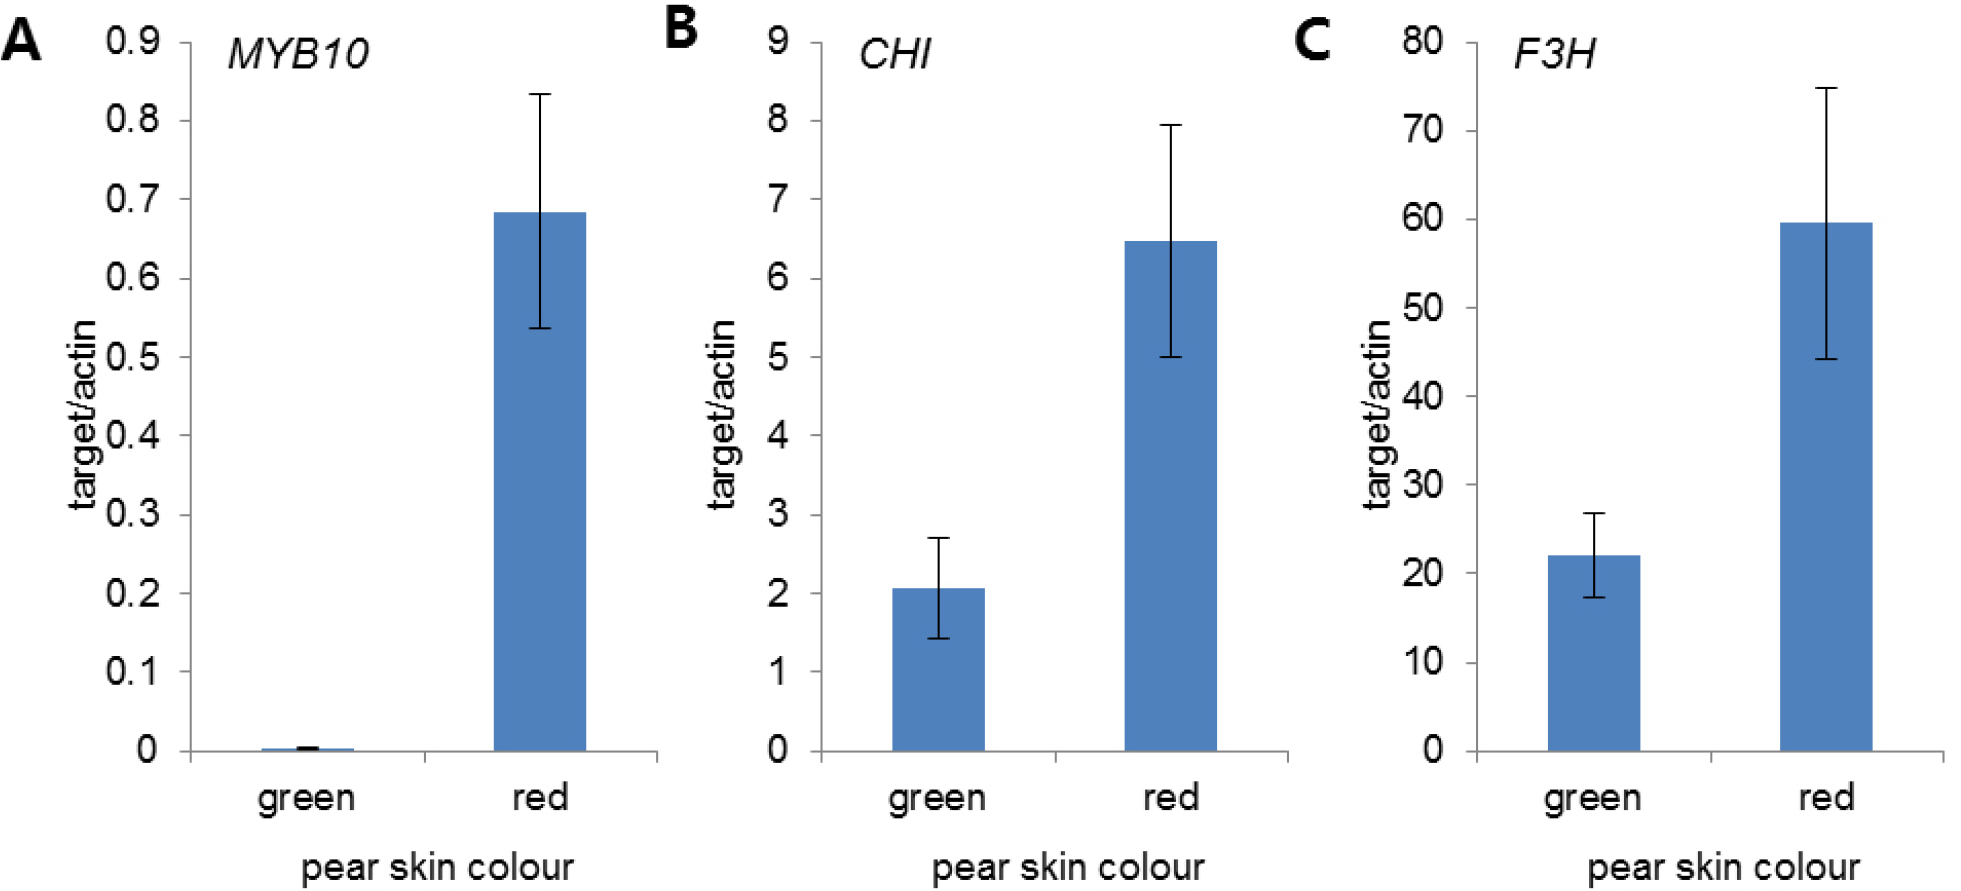
Seven anthocyanin biosynthesis genes, phenylalanine ammonialyase (PAL), chalcone synthase (CHS), chalcone isomerase (CHI), Flavanone 3-hydroxylase (F3H), dihydroflavonol-4- reductase (DFR), anthocyanidin synthase/leucoanthocyanidin dioxygenase (ANS/LDOX), UDP-glucose: flavonoid-3-O-glucosyltransferase (UFGT) were no sequence differences detected between the two cultivars in the SNP site. It is indicated that these genes cannot be used as molecular markers for the identification of skin color. Among the part of transcriptomes involved in the anthocyanin pathway, number of reads of MYB10, CHI, F3H genes were expressed more highly in ‘Rosired Bartlett’ than ‘Bartlett’. According to the results of transcriptome analysis, qRT-PCR was performed to analyze the expression levels of these genes. MYB10, CHI, F3H showed low expression in ‘Bartlett’, but high expression in ‘Rosired Bartlett’ (Fig. 4). CHI is involved in the second step of anthocyanin biosynthesis, making naringenin from chalcone however chalcone naturally causes isomerization even if there is no CHI in the plant (Kang et al., 2014).
GO analysis was performed using Gene Ontology Annotation Tool provided by DAVID program using TAIR 10_ID. ‘Bartlett’ and ‘Rosired Bartlett’ annotated 161 polymorphism SNPs (Table 1). There is no annotation information on the pear in phytozome, it has been aligned through BLASTP with pear amino acid sequences and protein sequences of 39 phytozome plant species and annotated TAIR10 with phytozome annotation information of the aligned plant species. In ‘Bartlett’ and ‘Rosired Bartlett’, the number of transcripts containing 161 polymorphism SNPs was 124, and 121 by TAIR_ID.
Table 1.
Polymorphism SNP profiles in ‘Rosired Bartlett’ and ‘Bartlett’.
| Sample | Total SNP | Homozygous SNP | Heterozygous SNP | Polymorphism SNP | Insertion | Deletion |
| ‘Rosired Bartlett’ | 7,773 | 4,965 | 2,808 | 43 | 65 | |
| ‘Bartlett’ | 7,373 | 5,217 | 2,156 | 32 | 37 | |
| Average | 7,573 | 5,091 | 2,482 | 161 | 38 | 51 |
All 21 SNP primers (Table 2) were constructed using 161 polymorphism SNPs which selected from the analysis of 12 germplasm accessions including six red-skinned pears and six green-skinned and scaffold155.0 and scaffold 60.0 primers were identified (Fig. 5). The SNP ID, scaffold155.0 exhibits adenine in ‘Rosired Bartlett’ but thymine in ‘Bartlett’. This trancript corresponds to the vacuolar protein sorting 46.1 gene, AT1G17730 in Arabidopsis (Barah et al., 2013), Pbr00 8844.1 in Pyrus bretschneideri (Wu et al., 2013) and is known to exhibit high expression at the maturity stage of fruit. The SNP ID, scaffold60.0 exhibits cytosine in ‘Rosired Bartlett’ but adenine in ‘Bartlett’. This trancriptome corresponds to the MOS4-associated complex 3A gene in Arabidopsis (Xu et al., 2012), Pbr033120.1 in Pyrus bretschneideri (Wu et al., 2013) and it has been reported to be expressed in relation to plant disease resistance. Pyrus bretschneideri and Pyrus communis genetic maps are partially available. So, we compared two SNP markers to Malus domestica (MalDom GD1.0) and GDR (GDDH13_v1.1). Scaffold 155.0 is located on chromosome 9 and scaffold 60.0 is located on chromosome 16. These two gene-based SNP primers are not directly related to anthocyanin biosynthesis, but were able to distinguish from red-skinned pears from green-skinned pears. Color fading of ‘Rosired Bartlett’ is responsible for anthocyanin transport to the vacuole. Scaffold155.0, vacuolar protein sorting 46.1 is involved in vacuolar transport and growth. So, this gene is thought to be involved in the reduction of anthocyanin in ‘Rosired Bartlett’ and is different from ‘Bartlett’ in SNP site. Subsequent studies are needed to determine which mechanisms can differentiate pear skin color. In addition, in order to utilize these SNPs as an early selection marker for the cultivation of red-skinned pear varieties, more diverse germplasm need to be tested. In fact, it should be compared with the phenotype expressed by application to the red skin pear cross-breeding group.
Table 2.
PCR amplicons showing polymorphic HRM profiles in ‘Rosired Bartlett’ and ‘Bartlett’.
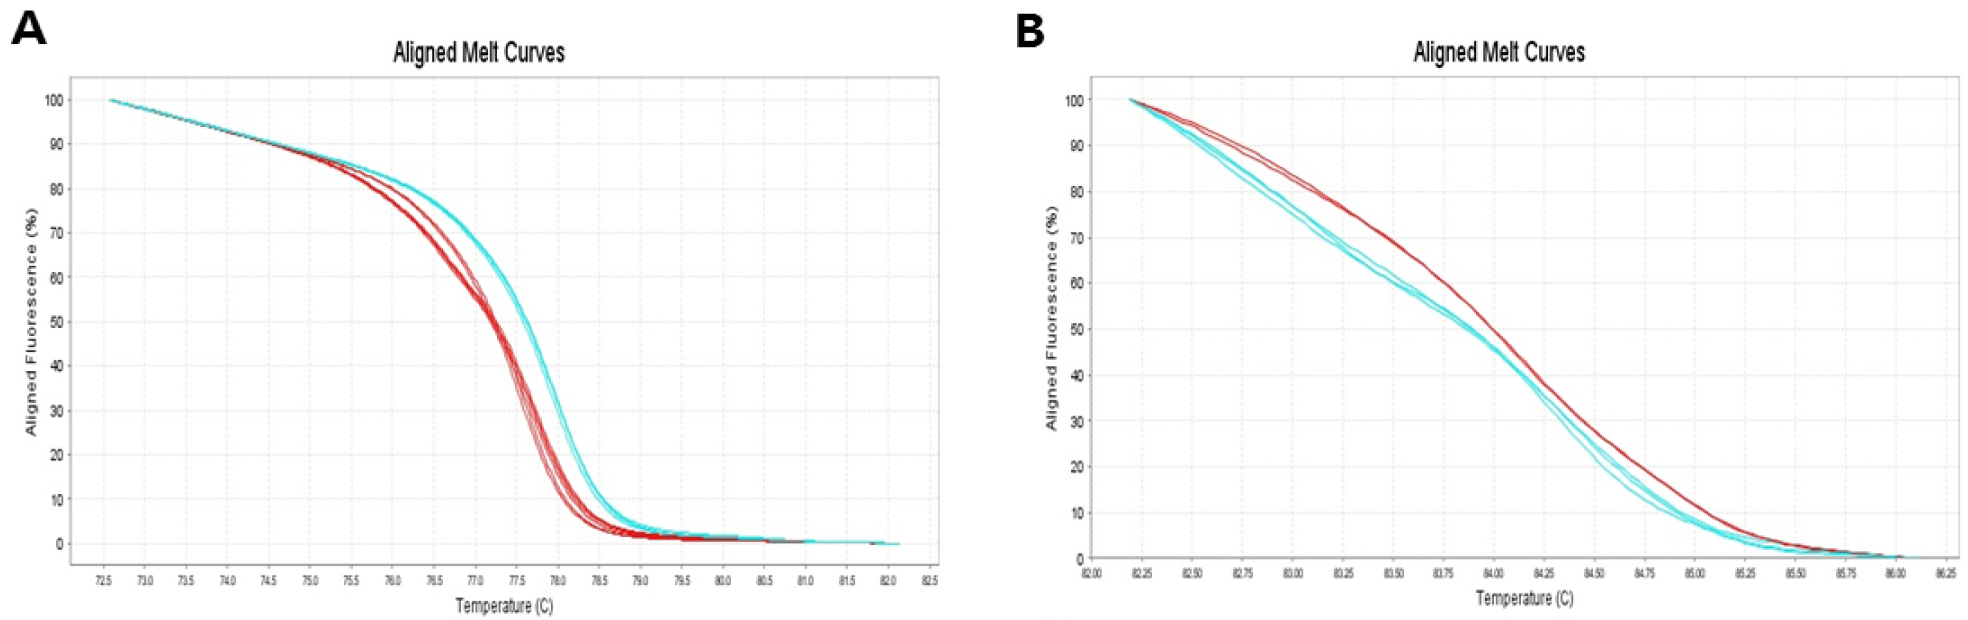
Fig. 5.
HRM analysis of 6 green-skinned pear cultivars (‘Bartlett’, ‘Luyun’, ‘Giant Sujeongbae’, ‘Chanxili’, ‘Chanxixueli’, ‘Kiyomaro’) and 6 red-skinned cultivars (‘Rosired Bartlett’, ‘Califonia’, ‘Canal Red’, ‘Sariquzal’, ‘Ooharabeni’, ‘Beniamin’). Blue line colors indicate green-skinned cultivars and red line colors indicate red-skinned cultivars. The SNP ID, scaffold155.0 showing two genotypes in normalized melting plot (A), The SNP ID, scaffold60.0 showing two genotypes in normalized melting plot (B).
This study was conducted to develop molecular markers that can discriminate pear cultivars based on their fruit skin color. cDNA libraries of red-skinned ‘Rosired Bartlett’ and green-skinned ‘Bartlett’ were prepared and genes involved in the expression of color by EST sequencing analysis were compared. SNP sites were identified and specific SNP molecular markers related to red skin expression were searched. We developed a molecular marker that could distinguish red-skinned cultivars from green-skinned cultivars. These results suggest that further works are needed to exact genotyping of red-skinned cultivars and cross seedlings. However, the development of such molecular markers will shorten the breeding period of the red-skinned pear and improve breeding efficiency.
